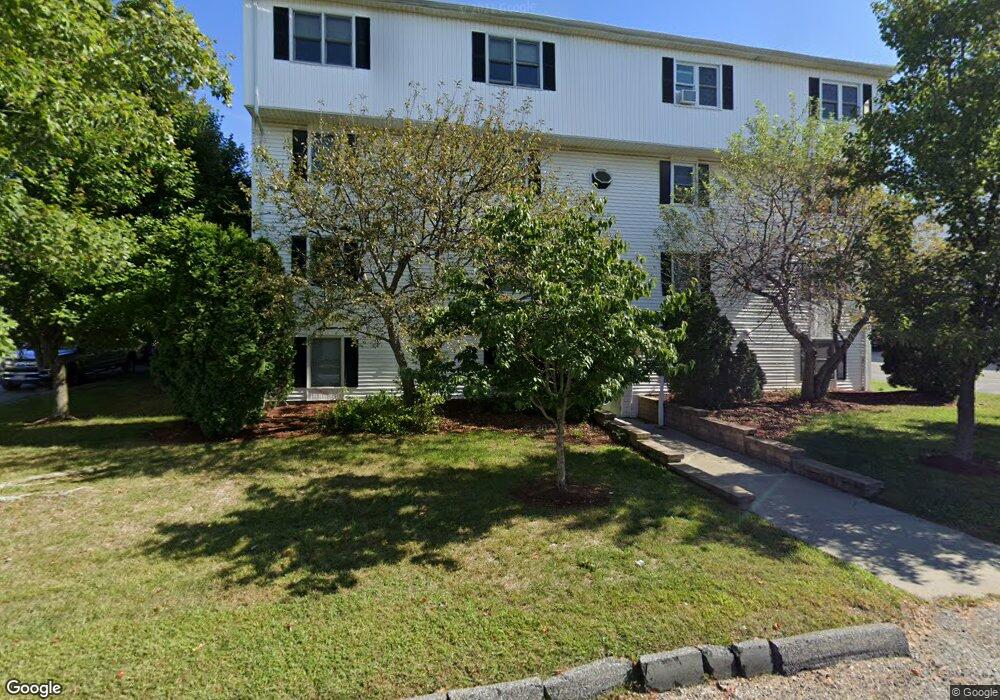
46 Gibbs St Unit 2A Worcester, MA 01607
Broadmeadow Brook NeighborhoodEstimated Value: $200,000 - $219,000
2
Beds
1
Bath
852
Sq Ft
$247/Sq Ft
Est. Value
About This Home
This home is located at 46 Gibbs St Unit 2A, Worcester, MA 01607 and is currently estimated at $210,329, approximately $246 per square foot. 46 Gibbs St Unit 2A is a home located in Worcester County with nearby schools including Vernon Hill Elementary School, Jacob Hiatt Magnet School, and Chandler Magnet.
Ownership History
Date
Name
Owned For
Owner Type
Purchase Details
Closed on
Mar 24, 2022
Sold by
Phan Yung M
Bought by
Toigo Valdenir and Toigo Edilane
Current Estimated Value
Purchase Details
Closed on
Jan 26, 2009
Sold by
Ofori Bernice
Bought by
Phan Yung M
Home Financials for this Owner
Home Financials are based on the most recent Mortgage that was taken out on this home.
Original Mortgage
$2,855
Interest Rate
5%
Purchase Details
Closed on
Jun 30, 2005
Sold by
46 2A Giblin T and 46 Paquette
Bought by
Ofori Bernice
Purchase Details
Closed on
Oct 26, 2004
Sold by
Giblin Adrienne M
Bought by
46 2A Giblin T and 46 Paquette
Purchase Details
Closed on
Jun 29, 2001
Sold by
Voelling Eric E
Bought by
Giblin Adrienne M
Purchase Details
Closed on
Jan 28, 2000
Sold by
Stawarz Frederic A
Bought by
Voellings Eric E
Create a Home Valuation Report for This Property
The Home Valuation Report is an in-depth analysis detailing your home's value as well as a comparison with similar homes in the area
Home Values in the Area
Average Home Value in this Area
Purchase History
| Date | Buyer | Sale Price | Title Company |
|---|---|---|---|
| Toigo Valdenir | $105,000 | None Available | |
| Phan Yung M | $77,000 | -- | |
| Phan Yung M | $77,000 | -- | |
| Ofori Bernice | $119,000 | -- | |
| Ofori Bernice | $119,000 | -- | |
| 46 2A Giblin T | -- | -- | |
| 46 2A Giblin T | -- | -- | |
| 46 2A Giblin T | -- | -- | |
| Giblin Adrienne M | $69,500 | -- | |
| Giblin Adrienne M | $69,500 | -- | |
| Voellings Eric E | $52,000 | -- |
Source: Public Records
Mortgage History
| Date | Status | Borrower | Loan Amount |
|---|---|---|---|
| Previous Owner | Voellings Eric E | $2,855 | |
| Previous Owner | Phan Yung M | $54,690 | |
| Previous Owner | Voellings Eric E | $20,000 |
Source: Public Records
Tax History Compared to Growth
Tax History
| Year | Tax Paid | Tax Assessment Tax Assessment Total Assessment is a certain percentage of the fair market value that is determined by local assessors to be the total taxable value of land and additions on the property. | Land | Improvement |
|---|---|---|---|---|
| 2025 | $2,180 | $165,300 | $0 | $165,300 |
| 2024 | $2,083 | $151,500 | $0 | $151,500 |
| 2023 | $1,856 | $129,400 | $0 | $129,400 |
| 2022 | $1,602 | $105,300 | $0 | $105,300 |
| 2021 | $1,913 | $117,500 | $0 | $117,500 |
| 2020 | $1,765 | $103,800 | $0 | $103,800 |
| 2019 | $1,537 | $85,400 | $0 | $85,400 |
| 2018 | $1,507 | $79,700 | $0 | $79,700 |
| 2017 | $1,501 | $78,100 | $0 | $78,100 |
| 2016 | $1,628 | $79,000 | $0 | $79,000 |
| 2015 | $1,586 | $79,000 | $0 | $79,000 |
| 2014 | $1,544 | $79,000 | $0 | $79,000 |
Source: Public Records
Map
Nearby Homes
- 46 Gibbs St Unit 4D
- 46 Gibbs St Unit 4C
- 46 Gibbs St Unit 4B
- 46 Gibbs St Unit 4A
- 46 Gibbs St Unit 3D
- 46 Gibbs St Unit 3C
- 46 Gibbs St Unit 3B
- 46 Gibbs St Unit 3A
- 46 Gibbs St Unit 2D
- 46 Gibbs St Unit 2C
- 46 Gibbs St Unit 2B
- 46 Gibbs St Unit 1D
- 46 Gibbs St Unit 1C
- 46 Gibbs St Unit 1B
- 46 Gibbs St Unit 1A
- 46 Gibbs St Unit 3A,46
- 46 Gibbs St Unit 1-3D
- 46 Gibbs St Unit 2A, 46
- 46 Gibbs St Unit 46
- 48 Gibbs St Unit 4D