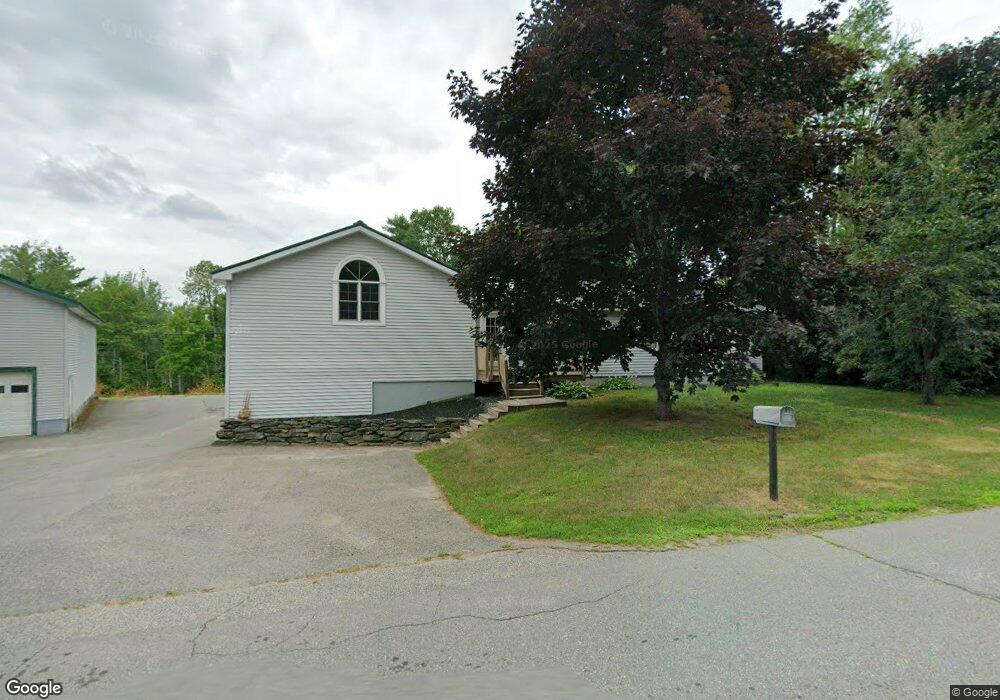
46 Hanscom Rd Benton, ME 04901
Estimated Value: $211,678 - $389,000
4
Beds
2
Baths
2,648
Sq Ft
$103/Sq Ft
Est. Value
About This Home
This home is located at 46 Hanscom Rd, Benton, ME 04901 and is currently estimated at $271,920, approximately $102 per square foot. 46 Hanscom Rd is a home located in Kennebec County with nearby schools including Lawrence High School.
Ownership History
Date
Name
Owned For
Owner Type
Purchase Details
Closed on
Jan 25, 2024
Sold by
Littlefield Brooke A
Bought by
Littlefield Lukas L
Current Estimated Value
Purchase Details
Closed on
Feb 7, 2020
Sold by
Littlefield Lukas L
Bought by
Littlefield Brooke A
Home Financials for this Owner
Home Financials are based on the most recent Mortgage that was taken out on this home.
Original Mortgage
$155,000
Interest Rate
3.74%
Mortgage Type
New Conventional
Purchase Details
Closed on
Jun 20, 2017
Sold by
Littlefield Kirstin A
Bought by
Littlefield Lukas L
Home Financials for this Owner
Home Financials are based on the most recent Mortgage that was taken out on this home.
Original Mortgage
$125,000
Interest Rate
4.02%
Mortgage Type
Commercial
Create a Home Valuation Report for This Property
The Home Valuation Report is an in-depth analysis detailing your home's value as well as a comparison with similar homes in the area
Home Values in the Area
Average Home Value in this Area
Purchase History
| Date | Buyer | Sale Price | Title Company |
|---|---|---|---|
| Littlefield Lukas L | $141,366 | None Available | |
| Littlefield Lukas L | $141,366 | None Available | |
| Littlefield Lukas L | $141,366 | None Available | |
| Littlefield Brooke A | -- | None Available | |
| Littlefield Brooke A | -- | None Available | |
| Littlefield Brooke A | -- | None Available | |
| Littlefield Lukas L | -- | -- | |
| Littlefield Lukas L | -- | -- | |
| Littlefield Lukas L | -- | -- |
Source: Public Records
Mortgage History
| Date | Status | Borrower | Loan Amount |
|---|---|---|---|
| Previous Owner | Littlefield Brooke A | $155,000 | |
| Previous Owner | Littlefield Lukas L | $125,000 |
Source: Public Records
Tax History
| Year | Tax Paid | Tax Assessment Tax Assessment Total Assessment is a certain percentage of the fair market value that is determined by local assessors to be the total taxable value of land and additions on the property. | Land | Improvement |
|---|---|---|---|---|
| 2025 | $3,055 | $218,200 | $34,740 | $183,460 |
| 2024 | $3,164 | $218,200 | $34,740 | $183,460 |
| 2023 | $2,815 | $218,200 | $34,740 | $183,460 |
| 2022 | $2,837 | $218,200 | $34,740 | $183,460 |
| 2021 | $2,776 | $155,950 | $20,920 | $135,030 |
| 2020 | $2,448 | $155,950 | $20,920 | $135,030 |
| 2019 | $2,787 | $155,950 | $20,920 | $135,030 |
| 2018 | $2,633 | $155,950 | $20,920 | $135,030 |
| 2017 | $2,722 | $155,950 | $20,920 | $135,030 |
| 2016 | $2,137 | $155,950 | $20,920 | $135,030 |
| 2015 | $2,105 | $155,950 | $20,920 | $135,030 |
| 2014 | $2,121 | $155,950 | $20,920 | $135,030 |
| 2013 | $2,043 | $155,950 | $20,920 | $135,030 |
Source: Public Records
Map
Nearby Homes
- 301 Unity Rd
- 595 Bangor Rd
- 158 Pleasant St
- Lot 44 Bangor Rd
- 28 Sebasticook Dr
- 151 Bangor Rd
- M18Lot 11 Main St
- 21 Water St
- 17 Main St
- 323 Neck Rd
- 156 Railroad St
- 137 China Rd
- 653 Abbott Rd
- 110 Hill Rd
- Lot #58 S Vigue Shore Rd
- 118 Marden Shore Rd
- 141 Albion Rd
- 436 N Pond Rd
- 45 Marden Shore Rd
- 389 Mutton Ln
Your Personal Tour Guide
Ask me questions while you tour the home.