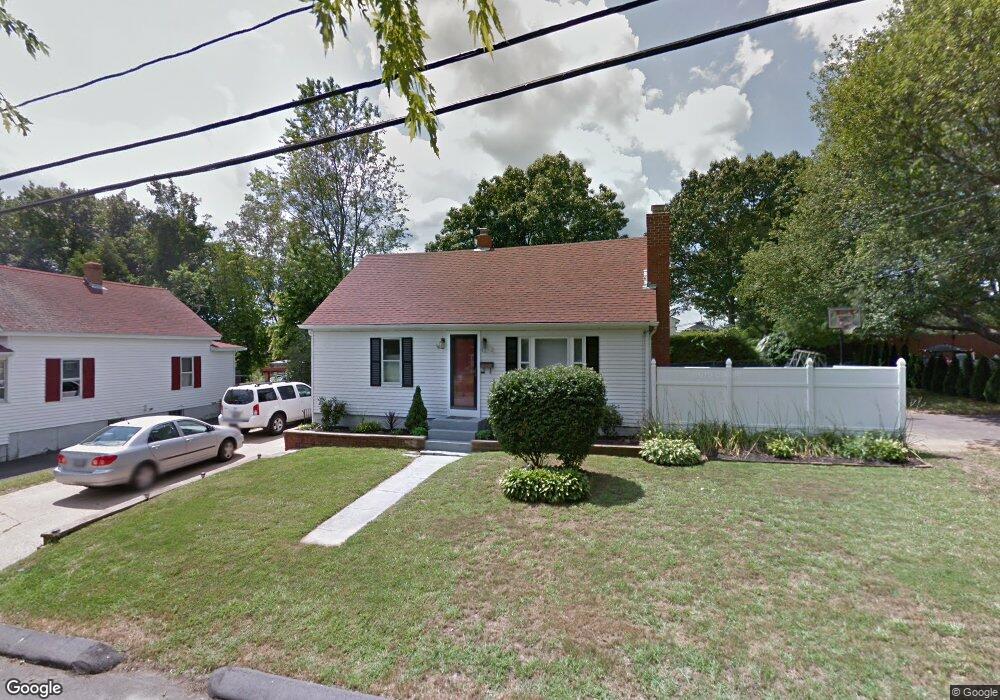
46 Harding St West Warwick, RI 02893
Lippitt-Harris NeighborhoodEstimated Value: $393,349 - $468,000
2
Beds
2
Baths
1,512
Sq Ft
$284/Sq Ft
Est. Value
About This Home
This home is located at 46 Harding St, West Warwick, RI 02893 and is currently estimated at $429,087, approximately $283 per square foot. 46 Harding St is a home located in Kent County with nearby schools including West Warwick High School, St Joseph School, and Islamic School of Rhode Island.
Ownership History
Date
Name
Owned For
Owner Type
Purchase Details
Closed on
Jun 20, 2024
Sold by
Lopes Michael W and Carreira-Lopes Dolores M
Bought by
Carreira-Lopes Dolores M
Current Estimated Value
Purchase Details
Closed on
Sep 6, 2002
Sold by
Carreira Joseph N and Carreira Maria C
Bought by
Lopes Michael W and Carreira-Lopes Dolores
Create a Home Valuation Report for This Property
The Home Valuation Report is an in-depth analysis detailing your home's value as well as a comparison with similar homes in the area
Home Values in the Area
Average Home Value in this Area
Purchase History
| Date | Buyer | Sale Price | Title Company |
|---|---|---|---|
| Carreira-Lopes Dolores M | -- | None Available | |
| Lopes Michael W | $145,000 | -- | |
| Lopes Michael W | $145,000 | -- |
Source: Public Records
Mortgage History
| Date | Status | Borrower | Loan Amount |
|---|---|---|---|
| Previous Owner | Lopes Michael W | $10,000 | |
| Previous Owner | Lopes Michael W | $123,200 | |
| Previous Owner | Lopes Michael W | $30,000 |
Source: Public Records
Tax History Compared to Growth
Tax History
| Year | Tax Paid | Tax Assessment Tax Assessment Total Assessment is a certain percentage of the fair market value that is determined by local assessors to be the total taxable value of land and additions on the property. | Land | Improvement |
|---|---|---|---|---|
| 2025 | $4,633 | $324,200 | $87,500 | $236,700 |
| 2024 | $5,003 | $267,700 | $71,500 | $196,200 |
| 2023 | $4,904 | $267,700 | $71,500 | $196,200 |
| 2022 | $4,829 | $267,700 | $71,500 | $196,200 |
| 2021 | $4,653 | $202,300 | $60,100 | $142,200 |
| 2020 | $4,653 | $202,300 | $60,100 | $142,200 |
| 2019 | $5,931 | $202,300 | $60,100 | $142,200 |
| 2018 | $4,142 | $152,400 | $57,500 | $94,900 |
| 2017 | $4,010 | $152,400 | $57,500 | $94,900 |
| 2016 | $3,938 | $152,400 | $57,500 | $94,900 |
| 2015 | $3,969 | $152,900 | $57,500 | $95,400 |
| 2014 | $3,882 | $152,900 | $57,500 | $95,400 |
Source: Public Records
Map
Nearby Homes