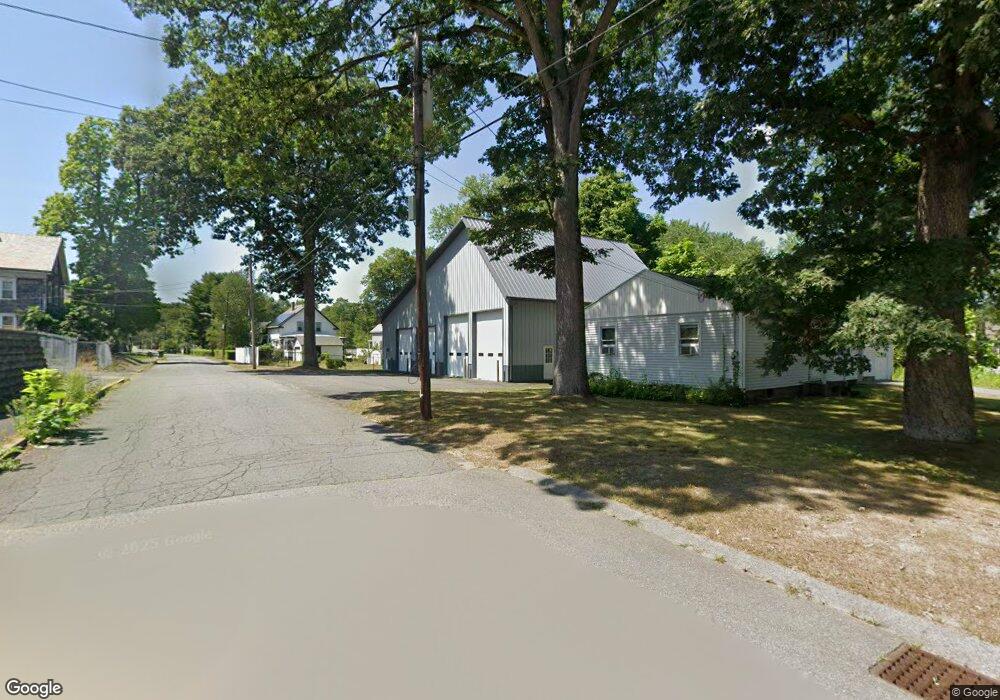
46 Hayden St Orange, MA 01364
Estimated Value: $259,000 - $307,000
2
Beds
1
Bath
925
Sq Ft
$308/Sq Ft
Est. Value
About This Home
This home is located at 46 Hayden St, Orange, MA 01364 and is currently estimated at $284,982, approximately $308 per square foot. 46 Hayden St is a home located in Franklin County with nearby schools including Fisher Hill and Ralph C Mahar Regional School.
Ownership History
Date
Name
Owned For
Owner Type
Purchase Details
Closed on
Mar 31, 1992
Sold by
Workers Cu
Bought by
Noel Richard J and Noel Denise A
Current Estimated Value
Home Financials for this Owner
Home Financials are based on the most recent Mortgage that was taken out on this home.
Original Mortgage
$50,000
Interest Rate
8.66%
Mortgage Type
Purchase Money Mortgage
Purchase Details
Closed on
Oct 30, 1991
Sold by
Thoren Elaine
Bought by
Workers Credit Union
Create a Home Valuation Report for This Property
The Home Valuation Report is an in-depth analysis detailing your home's value as well as a comparison with similar homes in the area
Home Values in the Area
Average Home Value in this Area
Purchase History
| Date | Buyer | Sale Price | Title Company |
|---|---|---|---|
| Noel Richard J | $55,000 | -- | |
| Workers Credit Union | $75,000 | -- |
Source: Public Records
Mortgage History
| Date | Status | Borrower | Loan Amount |
|---|---|---|---|
| Closed | Workers Credit Union | $50,000 | |
| Previous Owner | Workers Credit Union | $87,700 |
Source: Public Records
Tax History Compared to Growth
Tax History
| Year | Tax Paid | Tax Assessment Tax Assessment Total Assessment is a certain percentage of the fair market value that is determined by local assessors to be the total taxable value of land and additions on the property. | Land | Improvement |
|---|---|---|---|---|
| 2025 | $48 | $294,200 | $28,000 | $266,200 |
| 2024 | $4,581 | $262,700 | $28,000 | $234,700 |
| 2023 | $4,434 | $246,900 | $25,200 | $221,700 |
| 2022 | $4,361 | $228,100 | $25,200 | $202,900 |
| 2021 | $4,656 | $232,200 | $44,300 | $187,900 |
| 2020 | $4,568 | $224,700 | $40,400 | $184,300 |
| 2019 | $4,556 | $202,300 | $35,000 | $167,300 |
| 2018 | $3,695 | $168,400 | $32,600 | $135,800 |
| 2017 | $3,575 | $168,400 | $32,600 | $135,800 |
| 2016 | $3,502 | $161,400 | $29,100 | $132,300 |
| 2015 | $2,868 | $138,100 | $31,100 | $107,000 |
| 2014 | $2,768 | $140,200 | $31,100 | $109,100 |
Source: Public Records
Map
Nearby Homes