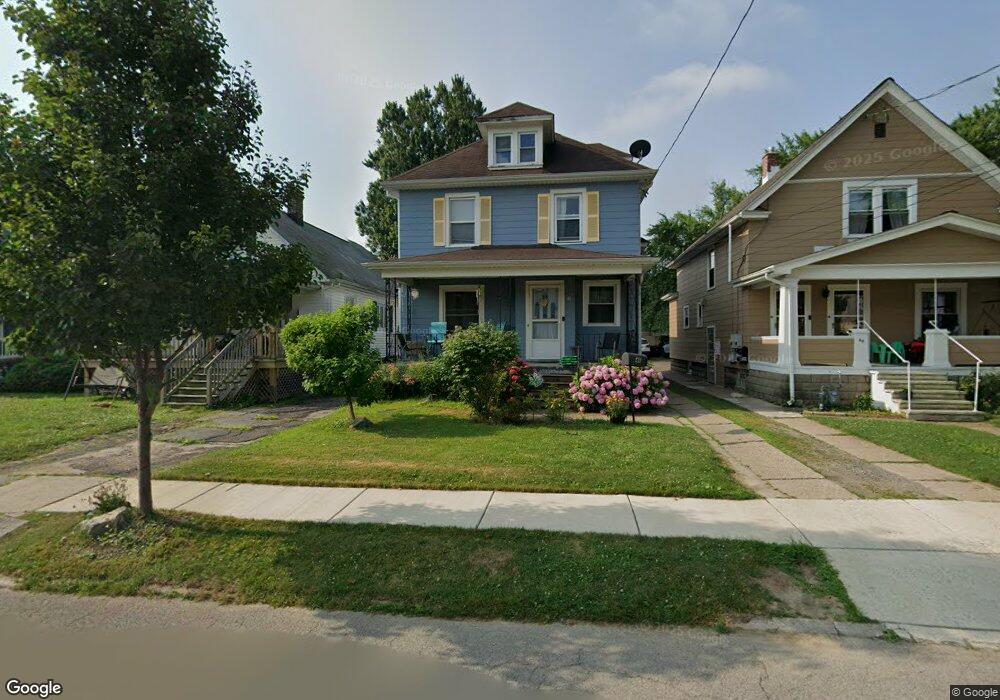
46 Ilion St Tonawanda, NY 14150
Estimated Value: $208,000 - $264,000
4
Beds
1
Bath
1,556
Sq Ft
$156/Sq Ft
Est. Value
About This Home
This home is located at 46 Ilion St, Tonawanda, NY 14150 and is currently estimated at $242,907, approximately $156 per square foot. 46 Ilion St is a home located in Erie County with nearby schools including Mullen Elementary School, Tonawanda Elementary School, and Tonawanda Middle High School.
Ownership History
Date
Name
Owned For
Owner Type
Purchase Details
Closed on
Jan 10, 2006
Sold by
Myers David E and Myers Elizabeth
Bought by
Mikulec Alan and Mikulec Niccole
Current Estimated Value
Home Financials for this Owner
Home Financials are based on the most recent Mortgage that was taken out on this home.
Original Mortgage
$19,980
Interest Rate
5.87%
Mortgage Type
Unknown
Purchase Details
Closed on
Jul 27, 2004
Sold by
Wachovia Bank Of Delaware Na
Bought by
Myers David E and Myers Elizabeth
Purchase Details
Closed on
Sep 4, 2003
Sold by
Harvey Christine C
Bought by
Wachovia Bank Of Delaware Na
Create a Home Valuation Report for This Property
The Home Valuation Report is an in-depth analysis detailing your home's value as well as a comparison with similar homes in the area
Home Values in the Area
Average Home Value in this Area
Purchase History
| Date | Buyer | Sale Price | Title Company |
|---|---|---|---|
| Mikulec Alan | $99,900 | None Available | |
| Myers David E | $30,000 | -- | |
| Wachovia Bank Of Delaware Na | $40,776 | -- |
Source: Public Records
Mortgage History
| Date | Status | Borrower | Loan Amount |
|---|---|---|---|
| Closed | Mikulec Alan | $19,980 | |
| Open | Mikulec Alan | $79,920 |
Source: Public Records
Tax History Compared to Growth
Tax History
| Year | Tax Paid | Tax Assessment Tax Assessment Total Assessment is a certain percentage of the fair market value that is determined by local assessors to be the total taxable value of land and additions on the property. | Land | Improvement |
|---|---|---|---|---|
| 2024 | $2,735 | $181,000 | $9,900 | $171,100 |
| 2023 | $2,211 | $181,000 | $9,900 | $171,100 |
| 2022 | $2,646 | $119,000 | $9,600 | $109,400 |
| 2021 | $2,636 | $119,000 | $9,600 | $109,400 |
| 2020 | $2,142 | $119,000 | $9,600 | $109,400 |
| 2019 | $3,691 | $119,000 | $9,600 | $109,400 |
| 2018 | $2,055 | $119,000 | $9,600 | $109,400 |
| 2017 | $545 | $90,000 | $9,000 | $81,000 |
| 2016 | $1,593 | $90,000 | $9,000 | $81,000 |
| 2015 | -- | $90,000 | $9,000 | $81,000 |
| 2014 | -- | $90,000 | $9,000 | $81,000 |
Source: Public Records
Map
Nearby Homes