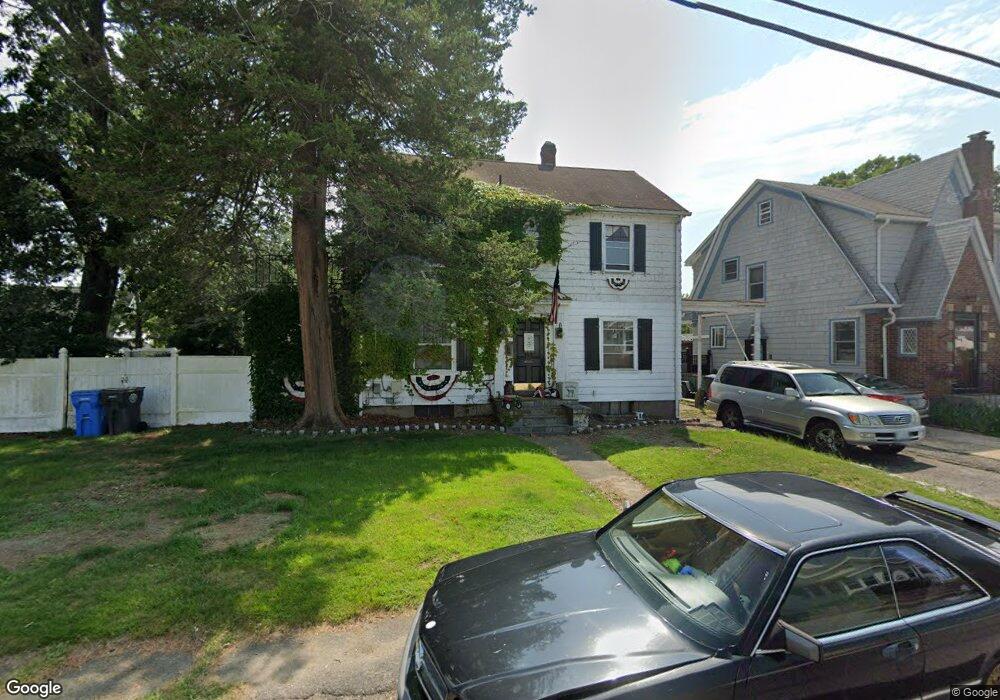
46 Ivanhoe St Cranston, RI 02910
Auburn NeighborhoodEstimated Value: $382,000 - $420,000
3
Beds
1
Bath
1,440
Sq Ft
$280/Sq Ft
Est. Value
About This Home
This home is located at 46 Ivanhoe St, Cranston, RI 02910 and is currently estimated at $402,983, approximately $279 per square foot. 46 Ivanhoe St is a home located in Providence County with nearby schools including Eden Park Elementary School, Park View Middle School, and Cranston High School East.
Ownership History
Date
Name
Owned For
Owner Type
Purchase Details
Closed on
Sep 22, 2003
Sold by
Es Gliottone Alfred Jr and Hartman Janet
Bought by
Grabowski Carey and Sukaskas Tara
Current Estimated Value
Home Financials for this Owner
Home Financials are based on the most recent Mortgage that was taken out on this home.
Original Mortgage
$174,500
Outstanding Balance
$81,340
Interest Rate
6.31%
Estimated Equity
$321,643
Purchase Details
Closed on
Jul 27, 2001
Sold by
Bergstrom Gunnar A and Bergstrom Marjorie
Bought by
Gliottone Alfred
Create a Home Valuation Report for This Property
The Home Valuation Report is an in-depth analysis detailing your home's value as well as a comparison with similar homes in the area
Home Values in the Area
Average Home Value in this Area
Purchase History
| Date | Buyer | Sale Price | Title Company |
|---|---|---|---|
| Grabowski Carey | $180,000 | -- | |
| Gliottone Alfred | $120,000 | -- |
Source: Public Records
Mortgage History
| Date | Status | Borrower | Loan Amount |
|---|---|---|---|
| Open | Gliottone Alfred | $30,000 | |
| Closed | Gliottone Alfred | $25,000 | |
| Closed | Gliottone Alfred | $14,000 | |
| Open | Gliottone Alfred | $174,500 |
Source: Public Records
Tax History
| Year | Tax Paid | Tax Assessment Tax Assessment Total Assessment is a certain percentage of the fair market value that is determined by local assessors to be the total taxable value of land and additions on the property. | Land | Improvement |
|---|---|---|---|---|
| 2025 | $4,200 | $302,600 | $99,700 | $202,900 |
| 2024 | $4,118 | $302,600 | $99,700 | $202,900 |
| 2023 | $4,111 | $217,500 | $68,700 | $148,800 |
| 2022 | $4,026 | $217,500 | $68,700 | $148,800 |
| 2021 | $3,915 | $217,500 | $68,700 | $148,800 |
| 2020 | $4,009 | $193,000 | $65,300 | $127,700 |
| 2019 | $4,009 | $193,000 | $65,300 | $127,700 |
| 2018 | $3,916 | $193,000 | $65,300 | $127,700 |
| 2017 | $3,815 | $166,300 | $48,100 | $118,200 |
| 2016 | $3,733 | $166,300 | $48,100 | $118,200 |
| 2015 | $3,733 | $166,300 | $48,100 | $118,200 |
| 2014 | $3,549 | $155,400 | $48,100 | $107,300 |
Source: Public Records
Map
Nearby Homes
Your Personal Tour Guide
Ask me questions while you tour the home.