A
Seller's Agent in 2019
AUDREY PENN
C-21 AWARD AGENCY
Estimated Value: $346,000 - $534,057
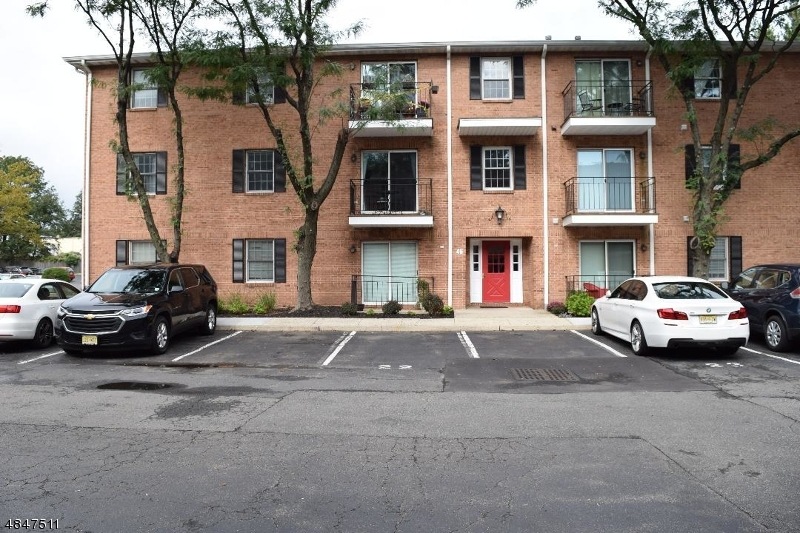
Immaculate 2nd floor end unit features hardwood floors, newly renovated kitchen (2016), stainless steel appliances, recessed lighting, gas stove/gas heat, plenty of closet space including walk-in closet in master, washer and dryer in unit. Storage unit onsite. Assigned parking space and available parking for additional car and visitors. Pets allowed. Near NJ/NY transit - free shuttle to train station.
Last Agent to Sell the Property
AUDREY PENN
C-21 AWARD AGENCY Listed on: 10/23/2018
| Date | Buyer | Sale Price | Title Company |
|---|---|---|---|
| -- | $271,000 | -- | |
| Upadhyay Drvang K | $100 | -- | |
| Upadhyay Devang K | $100 | -- | |
| Upadhyay Devang K | $126,000 | -- |
| Date | Status | Borrower | Loan Amount |
|---|---|---|---|
| Open | -- | $271,000 |
| Date | Event | Price | List to Sale | Price per Sq Ft |
|---|---|---|---|---|
| 01/25/2019 01/25/19 | Sold | $249,900 | 0.0% | -- |
| 11/27/2018 11/27/18 | Pending | -- | -- | -- |
| 10/23/2018 10/23/18 | For Sale | $249,900 | -- | -- |
| Year | Tax Paid | Tax Assessment Tax Assessment Total Assessment is a certain percentage of the fair market value that is determined by local assessors to be the total taxable value of land and additions on the property. | Land | Improvement |
|---|---|---|---|---|
| 2025 | $7,621 | $233,200 | $95,000 | $138,200 |
| 2024 | $7,621 | $233,200 | $95,000 | $138,200 |
| 2022 | $7,467 | $233,200 | $95,000 | $138,200 |
| 2021 | $7,329 | $233,200 | $95,000 | $138,200 |
| 2020 | $7,218 | $233,200 | $95,000 | $138,200 |
| 2019 | $5,820 | $146,200 | $67,000 | $79,200 |
| 2018 | $5,711 | $146,200 | $67,000 | $79,200 |
| 2017 | $5,695 | $146,200 | $67,000 | $79,200 |
| 2016 | $5,643 | $146,200 | $67,000 | $79,200 |
| 2015 | $5,592 | $146,200 | $67,000 | $79,200 |
| 2014 | $5,490 | $146,200 | $67,000 | $79,200 |
A
Seller's Agent in 2019
AUDREY PENN
C-21 AWARD AGENCY
M
Buyer's Agent in 2019
Marvin Gold
NEIGHBORHOOD ASSISTANCE CORP.
(848) 235-8173
1 in this area
7 Total Sales
Source: Garden State MLS
MLS Number: 3510995
APN: 02-00482-0000-00062-0000-CB025
Disclaimer: Certain information contained herein is derived from information provided by parties other than Homes.com. All information provided is deemed reliable, but is not guaranteed to be accurate and should be independently verified.
![]() The data relating to real estate for sale on this website comes in part from the IDX Program of Garden State Multiple Listing Service, L.L.C. Real estate listings held by other brokerage firms are marked as IDX Listing.
The data relating to real estate for sale on this website comes in part from the IDX Program of Garden State Multiple Listing Service, L.L.C. Real estate listings held by other brokerage firms are marked as IDX Listing.
Information deemed reliable but not guaranteed.
Copyright © 2026 Garden State Multiple Listing Service, L.L.C. All rights reserved.
Notice: The dissemination of listings on this website does not constitute the consent required by N.J.A.C. 11:5.6.1 (n) for the advertisement of listings exclusively for sale by another broker. Any such consent must be obtained in writing from the listing broker.
This information is being provided for Consumers’ personal, non-commercial use and may not be used for any purpose other than to identify prospective properties Consumers may be interested in purchasing.
