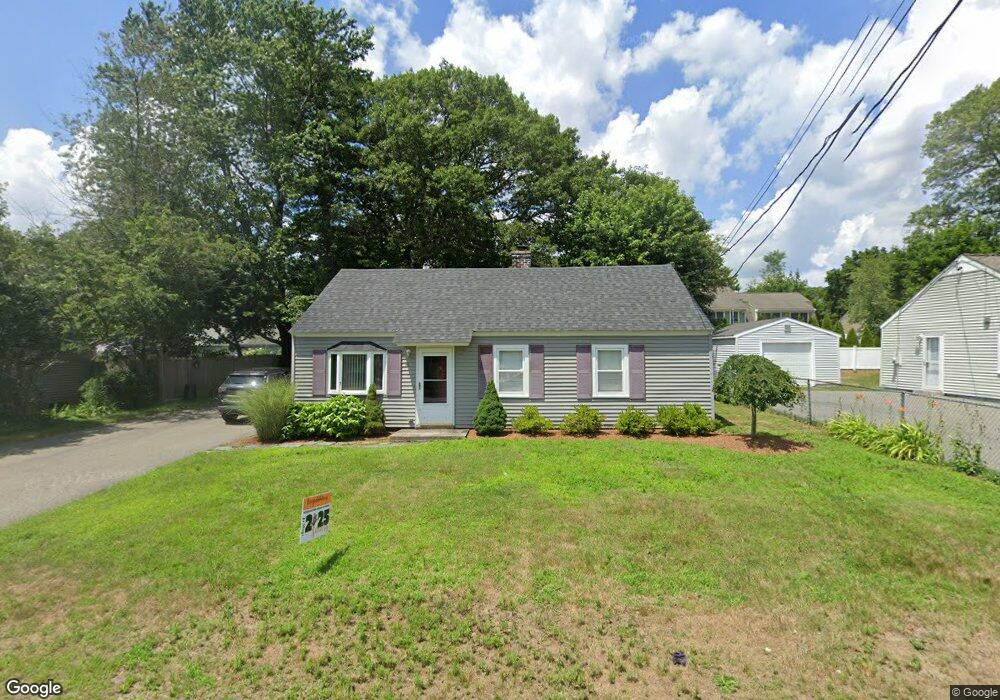
46 Kenmore Rd Stoughton, MA 02072
Estimated Value: $444,000 - $590,000
3
Beds
1
Bath
864
Sq Ft
$571/Sq Ft
Est. Value
About This Home
This home is located at 46 Kenmore Rd, Stoughton, MA 02072 and is currently estimated at $493,634, approximately $571 per square foot. 46 Kenmore Rd is a home located in Norfolk County with nearby schools including Wilkins Elementary School, Dr. Robert G. O'Donnell Middle School, and Stoughton High School.
Ownership History
Date
Name
Owned For
Owner Type
Purchase Details
Closed on
Sep 29, 2005
Sold by
Gingras Kristie and Gingras Michael
Bought by
Oconner James E
Current Estimated Value
Home Financials for this Owner
Home Financials are based on the most recent Mortgage that was taken out on this home.
Original Mortgage
$220,000
Outstanding Balance
$116,903
Interest Rate
5.84%
Mortgage Type
Purchase Money Mortgage
Estimated Equity
$376,731
Purchase Details
Closed on
Jun 12, 2003
Sold by
Brown Thomas E
Bought by
Gingras Michael and Gingras Kristie
Home Financials for this Owner
Home Financials are based on the most recent Mortgage that was taken out on this home.
Original Mortgage
$204,150
Interest Rate
5.77%
Mortgage Type
Purchase Money Mortgage
Purchase Details
Closed on
Jun 29, 2000
Sold by
Kiddy Christine M
Bought by
Brown Thomas E
Home Financials for this Owner
Home Financials are based on the most recent Mortgage that was taken out on this home.
Original Mortgage
$119,120
Interest Rate
8.59%
Mortgage Type
Purchase Money Mortgage
Create a Home Valuation Report for This Property
The Home Valuation Report is an in-depth analysis detailing your home's value as well as a comparison with similar homes in the area
Home Values in the Area
Average Home Value in this Area
Purchase History
| Date | Buyer | Sale Price | Title Company |
|---|---|---|---|
| Oconner James E | $275,000 | -- | |
| Oconner James E | $275,000 | -- | |
| Gingras Michael | $215,000 | -- | |
| Gingras Michael | $215,000 | -- | |
| Brown Thomas E | $148,900 | -- |
Source: Public Records
Mortgage History
| Date | Status | Borrower | Loan Amount |
|---|---|---|---|
| Open | Oconner James E | $220,000 | |
| Closed | Oconner James E | $41,250 | |
| Closed | Brown Thomas E | $220,000 | |
| Previous Owner | Gingras Michael | $204,150 | |
| Previous Owner | Brown Thomas E | $119,120 | |
| Previous Owner | Brown Thomas E | $10,000 |
Source: Public Records
Tax History Compared to Growth
Tax History
| Year | Tax Paid | Tax Assessment Tax Assessment Total Assessment is a certain percentage of the fair market value that is determined by local assessors to be the total taxable value of land and additions on the property. | Land | Improvement |
|---|---|---|---|---|
| 2025 | $4,574 | $369,500 | $203,400 | $166,100 |
| 2024 | $4,453 | $349,800 | $185,400 | $164,400 |
| 2023 | $4,270 | $315,100 | $172,200 | $142,900 |
| 2022 | $4,059 | $281,700 | $157,500 | $124,200 |
| 2021 | $3,893 | $257,800 | $142,700 | $115,100 |
| 2020 | $3,766 | $252,900 | $137,800 | $115,100 |
| 2019 | $3,738 | $243,700 | $137,800 | $105,900 |
| 2018 | $3,337 | $225,300 | $131,200 | $94,100 |
| 2017 | $3,136 | $216,400 | $124,700 | $91,700 |
| 2016 | $2,958 | $197,600 | $114,800 | $82,800 |
| 2015 | $2,891 | $191,100 | $108,300 | $82,800 |
| 2014 | $2,647 | $168,200 | $98,400 | $69,800 |
Source: Public Records
Map
Nearby Homes
- 229 Stoughton St
- 32 Doty Dr
- 178 Carey Cir
- 102 Ewing Dr
- 0 Washington St Unit 72888098
- 0 Washington St Unit 71897113
- 120 Charles Ave
- 163 Pearl St
- 28 Faxon St Unit 4
- 26 Faxon St Unit 2
- 84 Pearl St
- 11 Monk St
- 30 Porter St
- 81 Summer St Unit 1
- 316 Pleasant St
- 6 Grove St
- 514 Park
- 32 Marys Way
- 280 Deady Ave
- 59 Summer Ave
- 54 Kenmore Rd
- 25 Wellesley Rd
- 31 Wellesley Rd
- 17 Wellesley Rd
- 62 Kenmore Rd
- 43 Kenmore Rd
- 1 Wellesley Rd
- 51 Kenmore Rd
- 35 Kenmore Rd
- 59 Kenmore Rd
- 39 Wellesley Rd
- 70 Kenmore Rd
- 70 Kenmore Rd Unit 1
- 29 Kenmore Rd
- 65 Kenmore Rd
- 84 Ralph Mann Dr
- 76 Ralph Mann Dr
- 30 Wellesley Rd
- 23 Kenmore Rd
- 90 Ralph Mann Dr