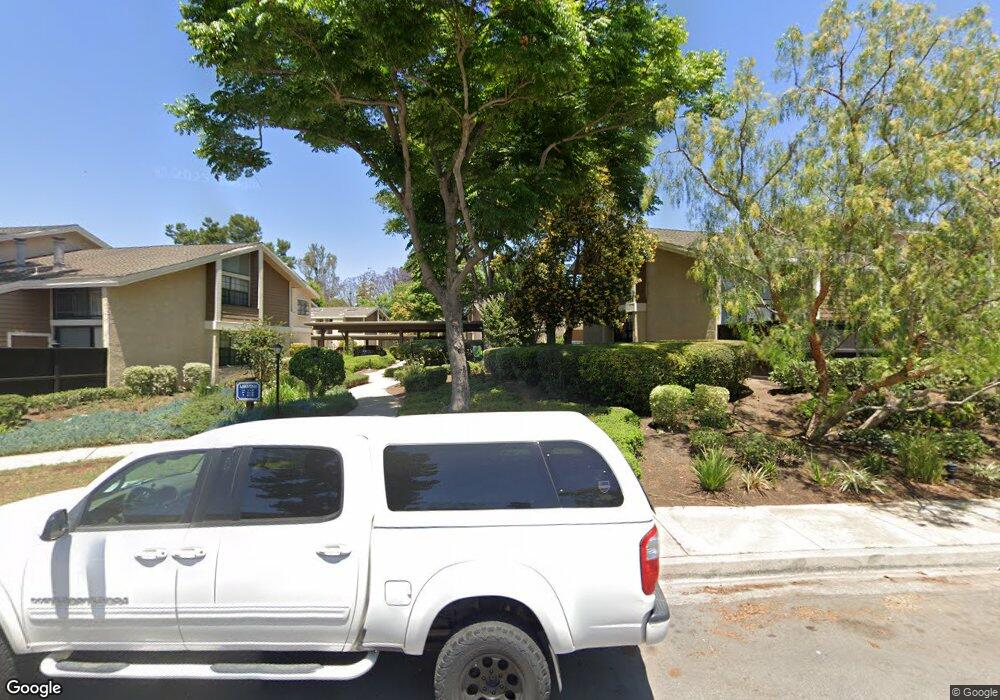
46 Lakepines Irvine, CA 92620
Northwood NeighborhoodEstimated Value: $627,000 - $722,117
1
Bed
1
Bath
934
Sq Ft
$711/Sq Ft
Est. Value
About This Home
This home is located at 46 Lakepines, Irvine, CA 92620 and is currently estimated at $664,029, approximately $710 per square foot. 46 Lakepines is a home located in Orange County with nearby schools including Santiago Hills Elementary School, Sierra Vista Middle School, and Northwood High School.
Ownership History
Date
Name
Owned For
Owner Type
Purchase Details
Closed on
May 26, 2023
Sold by
Boitano Ron
Bought by
Hazem John
Current Estimated Value
Purchase Details
Closed on
Feb 23, 2023
Sold by
Marilyn Boitano Trust
Bought by
Boitano Ron
Purchase Details
Closed on
Oct 11, 2018
Sold by
Balquist John and Boitano Marilyn A
Bought by
Balquist John and Marily Boitano Trust
Purchase Details
Closed on
Mar 25, 2016
Sold by
Boitano Ron D
Bought by
Boitano Marilyn A
Purchase Details
Closed on
Sep 23, 2015
Sold by
Boitano Marilyn A
Bought by
Boitano Ron D
Create a Home Valuation Report for This Property
The Home Valuation Report is an in-depth analysis detailing your home's value as well as a comparison with similar homes in the area
Home Values in the Area
Average Home Value in this Area
Purchase History
| Date | Buyer | Sale Price | Title Company |
|---|---|---|---|
| Hazem John | $180,000 | Fidelity National Title | |
| Boitano Ron | -- | -- | |
| Balquist John | -- | None Available | |
| Boitano Marilyn A | -- | None Available | |
| Boitano Ron D | -- | None Available |
Source: Public Records
Tax History
| Year | Tax Paid | Tax Assessment Tax Assessment Total Assessment is a certain percentage of the fair market value that is determined by local assessors to be the total taxable value of land and additions on the property. | Land | Improvement |
|---|---|---|---|---|
| 2025 | $6,124 | $582,624 | $496,290 | $86,334 |
| 2024 | $6,124 | $571,200 | $486,558 | $84,642 |
| 2023 | $4,399 | $407,435 | $323,936 | $83,499 |
| 2022 | $3,645 | $334,654 | $261,621 | $73,033 |
| 2021 | $3,559 | $328,093 | $256,492 | $71,601 |
| 2020 | $3,540 | $324,729 | $253,862 | $70,867 |
| 2019 | $3,461 | $318,362 | $248,884 | $69,478 |
| 2018 | $3,399 | $312,120 | $244,004 | $68,116 |
| 2017 | $3,329 | $306,000 | $239,219 | $66,781 |
| 2016 | $3,185 | $300,000 | $233,441 | $66,559 |
| 2015 | $1,542 | $141,728 | $70,535 | $71,193 |
| 2014 | $1,513 | $138,952 | $69,153 | $69,799 |
Source: Public Records
Map
Nearby Homes
Your Personal Tour Guide
Ask me questions while you tour the home.