Estimated Value: $243,000 - $275,000
3
Beds
3
Baths
1,977
Sq Ft
$131/Sq Ft
Est. Value
About This Home
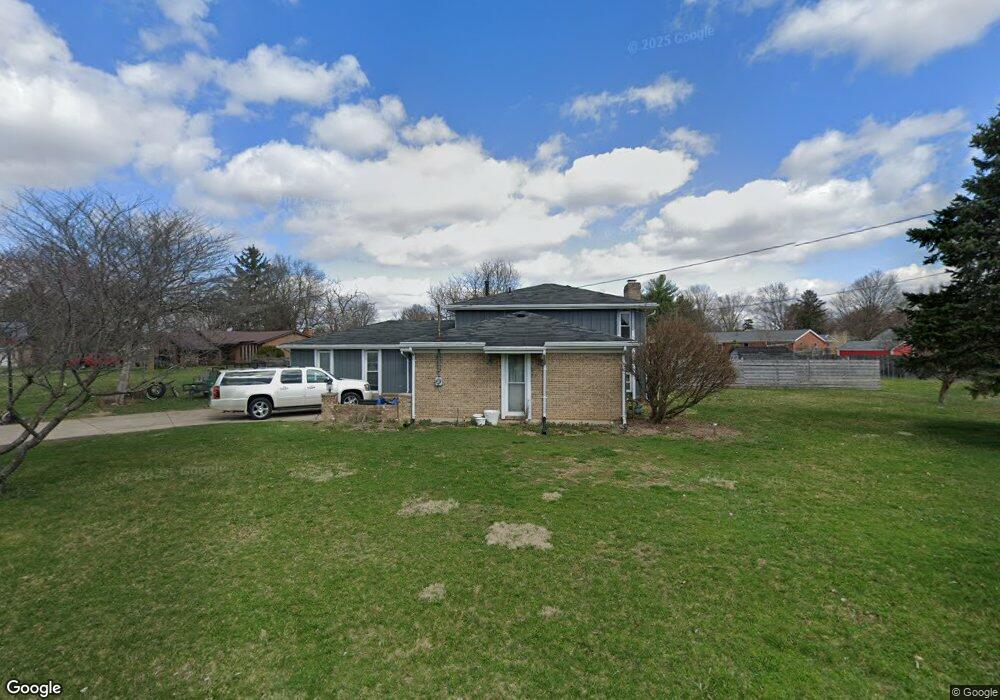
This home is located at 46 Matthews Ave, Enon, OH 45323 and is currently estimated at $258,255, approximately $130 per square foot. 46 Matthews Ave is a home located in Clark County with nearby schools including Greenon Elementary School, Greenon Jr. High School, and Greenon High School.
Ownership History
Date
Name
Owned For
Owner Type
Purchase Details
Closed on
Jun 3, 2022
Sold by
Dalzell Heather C and Dalzell Jason S
Bought by
Cox Levi and Brown Julia
Current Estimated Value
Home Financials for this Owner
Home Financials are based on the most recent Mortgage that was taken out on this home.
Original Mortgage
$201,286
Outstanding Balance
$190,111
Interest Rate
5.1%
Mortgage Type
FHA
Estimated Equity
$68,144
Purchase Details
Closed on
Feb 26, 2018
Sold by
Daizell Jackie L
Bought by
Daizell Jason and Daizell Heather
Purchase Details
Closed on
Sep 2, 2016
Sold by
Eckert Robert W
Bought by
Dalzell Jason S and Dalzell Heather
Home Financials for this Owner
Home Financials are based on the most recent Mortgage that was taken out on this home.
Original Mortgage
$132,554
Interest Rate
3.45%
Mortgage Type
FHA
Create a Home Valuation Report for This Property
The Home Valuation Report is an in-depth analysis detailing your home's value as well as a comparison with similar homes in the area
Home Values in the Area
Average Home Value in this Area
Purchase History
| Date | Buyer | Sale Price | Title Company |
|---|---|---|---|
| Cox Levi | $205,000 | First Ohio Title Agency | |
| Daizell Jason | -- | None Available | |
| Dalzell Jason S | $135,000 | Performance Title Inc |
Source: Public Records
Mortgage History
| Date | Status | Borrower | Loan Amount |
|---|---|---|---|
| Open | Cox Levi | $201,286 | |
| Previous Owner | Dalzell Jason S | $132,554 |
Source: Public Records
Tax History
| Year | Tax Paid | Tax Assessment Tax Assessment Total Assessment is a certain percentage of the fair market value that is determined by local assessors to be the total taxable value of land and additions on the property. | Land | Improvement |
|---|---|---|---|---|
| 2025 | $3,355 | $71,050 | $12,090 | $58,960 |
| 2024 | $3,370 | $57,420 | $9,950 | $47,470 |
| 2023 | $3,370 | $57,420 | $9,950 | $47,470 |
| 2022 | $3,294 | $57,420 | $9,950 | $47,470 |
| 2021 | $3,300 | $50,700 | $7,710 | $42,990 |
| 2020 | $3,307 | $50,700 | $7,710 | $42,990 |
| 2019 | $3,348 | $50,700 | $7,710 | $42,990 |
| 2018 | $3,231 | $47,510 | $8,170 | $39,340 |
| 2017 | $3,238 | $49,736 | $8,173 | $41,563 |
| 2016 | $2,782 | $49,736 | $8,173 | $41,563 |
| 2015 | $1,321 | $47,268 | $7,711 | $39,557 |
| 2014 | $2,647 | $47,268 | $7,711 | $39,557 |
| 2013 | $1,214 | $47,268 | $7,711 | $39,557 |
Source: Public Records
Map
Nearby Homes
- 144 Matthews Ave
- 4538 Cynthia Dr
- 1010 Meadow Lark Dr
- 4200 Phillips St
- 5463 Enon-Xenia Rd
- 4024 Raymond Dr
- 3924 Schenley St
- 6250 Fairfield Pike
- 0 Enon-Xenia Rd
- 199 Fairfield Pike
- 2133 Willow Run Cir Unit 2133
- 2151 Willow Run Cir Unit 2151
- 2072 Willow Run Cir
- 7050 Creekside Cir
- 7850 Kings Ridge Cir
- 46-48 W Main St
- 0 Enon Xenia Rd
- 100 Green Valley Dr
- 303 E Main St
- 141 N Xenia Dr
- 20 Huron Cir
- 53 Matthews Ave
- 785 Savannah Dr
- 61 Matthews Ave
- 775 Savannah Dr
- 92 Matthews Ave
- 47 Matthews Ave
- 77 Matthews Ave
- 81 Piqua Cir
- 30 Huron Cir
- 31 Piqua Cir
- 24 Matthews Ave
- 755 Savannah Dr
- 39 Matthews Ave
- 83 Matthews Ave
- 21 Piqua Cir
- 25 Matthews Ave
- 97 Matthews Ave
- 790 Savannah Dr
- 107 Maricopa Cir
Your Personal Tour Guide
Ask me questions while you tour the home.