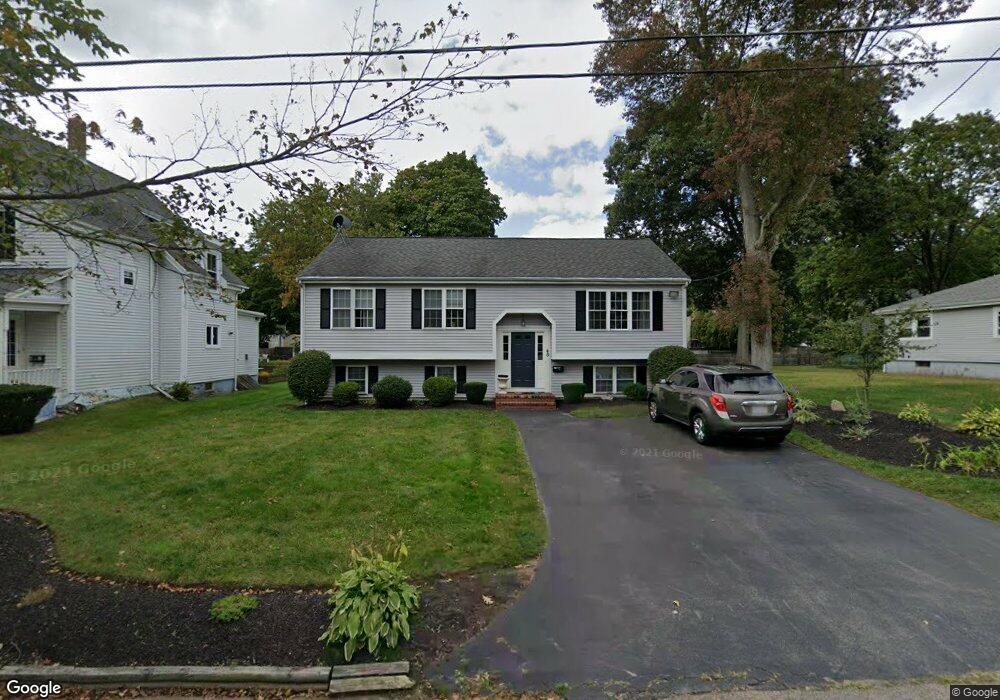
46 Montauk Rd Brockton, MA 02301
Estimated Value: $574,000 - $806,000
3
Beds
3
Baths
1,818
Sq Ft
$350/Sq Ft
Est. Value
About This Home
This home is located at 46 Montauk Rd, Brockton, MA 02301 and is currently estimated at $636,002, approximately $349 per square foot. 46 Montauk Rd is a home located in Plymouth County with nearby schools including Louis F Angelo Elementary School, Hancock Elementary School, and Raymond K-8 Elementary School.
Ownership History
Date
Name
Owned For
Owner Type
Purchase Details
Closed on
Jul 21, 2004
Sold by
Nagime Jarbas L
Bought by
Nagime Jarbas L
Current Estimated Value
Home Financials for this Owner
Home Financials are based on the most recent Mortgage that was taken out on this home.
Original Mortgage
$257,000
Outstanding Balance
$128,897
Interest Rate
6.28%
Mortgage Type
Purchase Money Mortgage
Estimated Equity
$507,105
Purchase Details
Closed on
Jun 17, 2004
Sold by
Rodrigues Janderson
Bought by
Rodrigues Janderson N and Nagme Jarbas L
Home Financials for this Owner
Home Financials are based on the most recent Mortgage that was taken out on this home.
Original Mortgage
$257,000
Outstanding Balance
$128,897
Interest Rate
6.28%
Mortgage Type
Purchase Money Mortgage
Estimated Equity
$507,105
Purchase Details
Closed on
Nov 13, 2002
Sold by
Cruise Prop Rt
Bought by
Rodrigues Janderson N
Home Financials for this Owner
Home Financials are based on the most recent Mortgage that was taken out on this home.
Original Mortgage
$251,910
Interest Rate
6.03%
Mortgage Type
Purchase Money Mortgage
Purchase Details
Closed on
Mar 28, 2002
Sold by
Clifford Sullian Rt and Clifford David M
Bought by
Cruise Property Rt and Cruise Patricia
Create a Home Valuation Report for This Property
The Home Valuation Report is an in-depth analysis detailing your home's value as well as a comparison with similar homes in the area
Home Values in the Area
Average Home Value in this Area
Purchase History
| Date | Buyer | Sale Price | Title Company |
|---|---|---|---|
| Nagime Jarbas L | -- | -- | |
| Rodrigues Janderson N | -- | -- | |
| Rodrigues Janderson N | $279,900 | -- | |
| Cruise Property Rt | $60,000 | -- |
Source: Public Records
Mortgage History
| Date | Status | Borrower | Loan Amount |
|---|---|---|---|
| Open | Cruise Property Rt | $19,000 | |
| Closed | Cruise Property Rt | $10,000 | |
| Open | Cruise Property Rt | $257,000 | |
| Previous Owner | Cruise Property Rt | $251,910 |
Source: Public Records
Tax History Compared to Growth
Tax History
| Year | Tax Paid | Tax Assessment Tax Assessment Total Assessment is a certain percentage of the fair market value that is determined by local assessors to be the total taxable value of land and additions on the property. | Land | Improvement |
|---|---|---|---|---|
| 2025 | $6,467 | $534,000 | $143,900 | $390,100 |
| 2024 | $6,101 | $507,600 | $143,900 | $363,700 |
| 2023 | $5,562 | $428,500 | $108,600 | $319,900 |
| 2022 | $5,775 | $413,400 | $98,600 | $314,800 |
| 2021 | $5,587 | $385,300 | $90,900 | $294,400 |
| 2020 | $5,104 | $336,900 | $87,400 | $249,500 |
| 2019 | $4,421 | $284,500 | $80,700 | $203,800 |
| 2018 | $4,084 | $254,300 | $80,700 | $173,600 |
| 2017 | $4,035 | $250,600 | $80,700 | $169,900 |
| 2016 | $4,173 | $240,400 | $73,000 | $167,400 |
| 2015 | $3,929 | $216,500 | $73,000 | $143,500 |
| 2014 | $3,940 | $217,300 | $73,000 | $144,300 |
Source: Public Records
Map
Nearby Homes
- 20 Montauk Rd
- 75 Colonel Bell Dr Unit 77-11
- 77 Colonel Bell Dr Unit 4
- 126 Coventry Cir
- 96 Coventry Cir
- 721 Pleasant St
- 45 Cross St
- 7 N Winnifred Rd
- 15 Troy St
- 4 Park Rd
- 161 Moraine St
- 72 Kurland Ave
- 508 Oak St Unit 10
- 114 Oak Ln Unit 11
- 72 W Elm Terrace
- 194 Prospect St
- 42 Baxendale Terrace
- 10 Fitzpatrick Ave
- 116 Oak Ln Unit 12
- 116 Oak Ln Unit 2