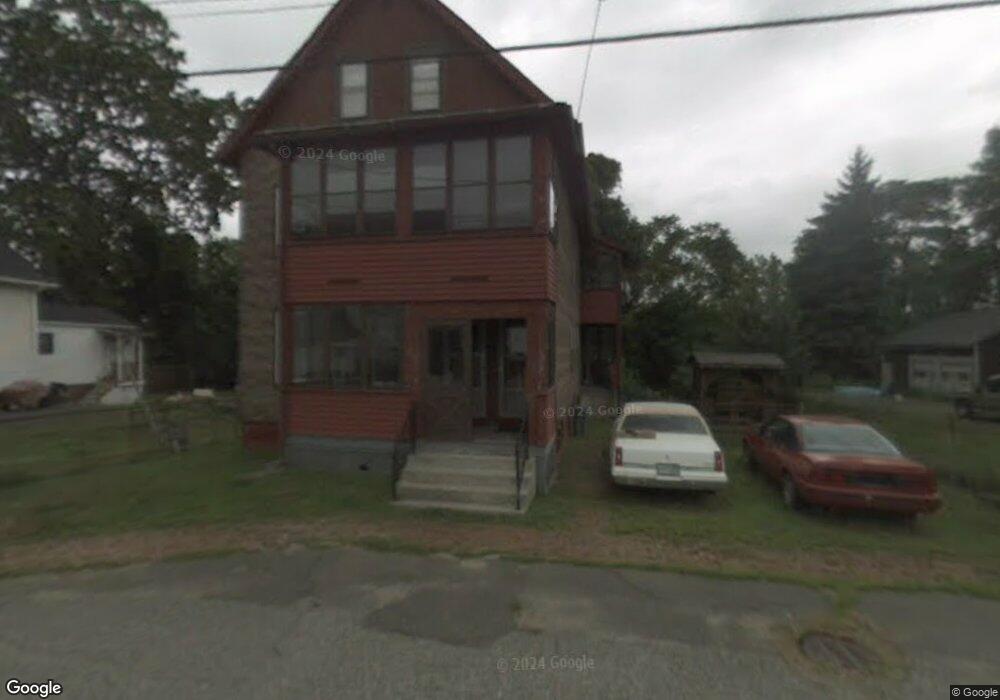
46 Moseley Ave West Springfield, MA 01089
Estimated Value: $350,922 - $420,000
8
Beds
2
Baths
2,125
Sq Ft
$186/Sq Ft
Est. Value
About This Home
This home is located at 46 Moseley Ave, West Springfield, MA 01089 and is currently estimated at $394,481, approximately $185 per square foot. 46 Moseley Ave is a home located in Hampden County with nearby schools including West Springfield High School, Hampden Charter School of Science West, and Libertas Academy Charter School.
Ownership History
Date
Name
Owned For
Owner Type
Purchase Details
Closed on
Mar 25, 2011
Sold by
Est Amodio Frances and Amodio Francis J
Bought by
Lachinov Ziya
Current Estimated Value
Home Financials for this Owner
Home Financials are based on the most recent Mortgage that was taken out on this home.
Original Mortgage
$60,000
Outstanding Balance
$41,766
Interest Rate
5.07%
Mortgage Type
Purchase Money Mortgage
Estimated Equity
$352,715
Purchase Details
Closed on
Apr 27, 2007
Sold by
Amodio Frances and Parzich Victoria
Bought by
Amodio Frances
Create a Home Valuation Report for This Property
The Home Valuation Report is an in-depth analysis detailing your home's value as well as a comparison with similar homes in the area
Home Values in the Area
Average Home Value in this Area
Purchase History
| Date | Buyer | Sale Price | Title Company |
|---|---|---|---|
| Lachinov Ziya | $75,000 | -- | |
| Amodio Frances | -- | -- |
Source: Public Records
Mortgage History
| Date | Status | Borrower | Loan Amount |
|---|---|---|---|
| Open | Lachinov Ziya | $60,000 |
Source: Public Records
Tax History
| Year | Tax Paid | Tax Assessment Tax Assessment Total Assessment is a certain percentage of the fair market value that is determined by local assessors to be the total taxable value of land and additions on the property. | Land | Improvement |
|---|---|---|---|---|
| 2025 | $4,489 | $301,900 | $85,100 | $216,800 |
| 2024 | $4,471 | $301,900 | $85,100 | $216,800 |
| 2023 | $4,002 | $257,500 | $85,100 | $172,400 |
| 2022 | $4,395 | $278,900 | $77,200 | $201,700 |
| 2021 | $3,542 | $209,600 | $61,600 | $148,000 |
| 2020 | $3,532 | $207,900 | $61,600 | $146,300 |
| 2019 | $3,526 | $207,900 | $61,600 | $146,300 |
| 2018 | $3,545 | $207,900 | $61,600 | $146,300 |
| 2017 | $3,545 | $207,900 | $61,600 | $146,300 |
| 2016 | $3,493 | $205,600 | $59,300 | $146,300 |
| 2015 | $2,530 | $148,900 | $58,100 | $90,800 |
| 2014 | $613 | $148,900 | $58,100 | $90,800 |
Source: Public Records
Map
Nearby Homes
Your Personal Tour Guide
Ask me questions while you tour the home.