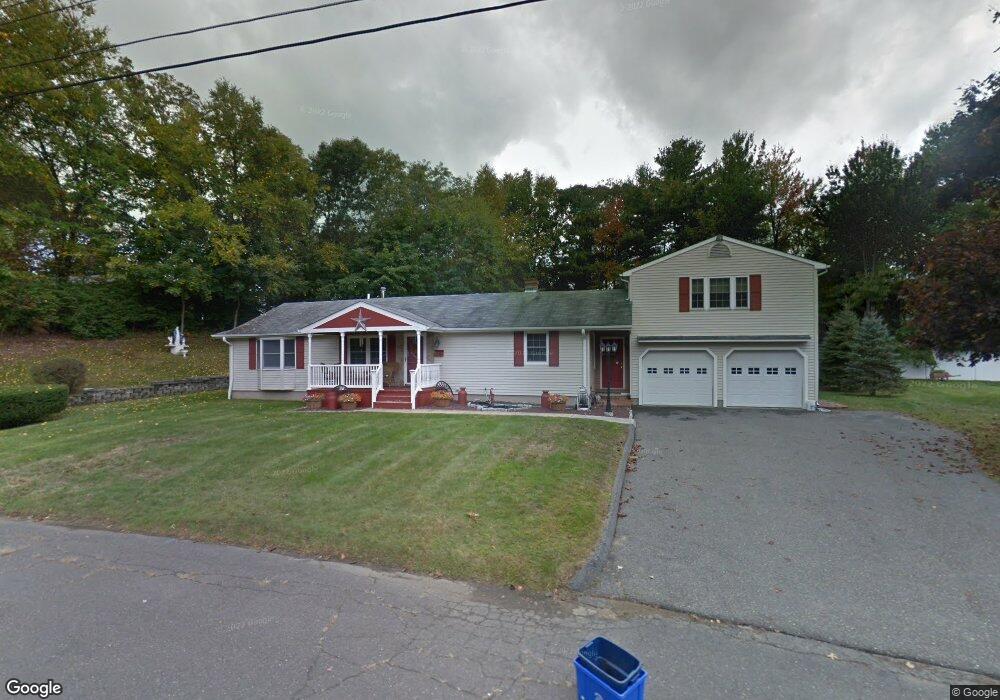
46 Mountain View Rd Ansonia, CT 06401
Estimated Value: $537,706 - $638,000
4
Beds
3
Baths
2,689
Sq Ft
$212/Sq Ft
Est. Value
About This Home
This home is located at 46 Mountain View Rd, Ansonia, CT 06401 and is currently estimated at $570,927, approximately $212 per square foot. 46 Mountain View Rd is a home located in New Haven County with nearby schools including Mead School, Prendergast School, and Ansonia Middle School.
Ownership History
Date
Name
Owned For
Owner Type
Purchase Details
Closed on
Dec 24, 2012
Sold by
Velardi Mark
Bought by
Velardi Mark
Current Estimated Value
Purchase Details
Closed on
May 16, 1988
Sold by
Cafasso Katharine
Bought by
Velardi Mark
Create a Home Valuation Report for This Property
The Home Valuation Report is an in-depth analysis detailing your home's value as well as a comparison with similar homes in the area
Home Values in the Area
Average Home Value in this Area
Purchase History
| Date | Buyer | Sale Price | Title Company |
|---|---|---|---|
| Velardi Mark | -- | -- | |
| Velardi Mark | $160,000 | -- |
Source: Public Records
Mortgage History
| Date | Status | Borrower | Loan Amount |
|---|---|---|---|
| Previous Owner | Velardi Mark | $160,000 | |
| Previous Owner | Velardi Mark | $100,000 | |
| Previous Owner | Velardi Mark | $112,000 | |
| Previous Owner | Velardi Mark | $118,000 |
Source: Public Records
Tax History Compared to Growth
Tax History
| Year | Tax Paid | Tax Assessment Tax Assessment Total Assessment is a certain percentage of the fair market value that is determined by local assessors to be the total taxable value of land and additions on the property. | Land | Improvement |
|---|---|---|---|---|
| 2025 | $8,687 | $304,290 | $57,050 | $247,240 |
| 2024 | $8,061 | $304,290 | $57,050 | $247,240 |
| 2023 | $7,985 | $304,290 | $57,050 | $247,240 |
| 2022 | $7,825 | $207,000 | $70,200 | $136,800 |
| 2021 | $7,825 | $207,000 | $70,200 | $136,800 |
| 2020 | $7,825 | $207,000 | $70,200 | $136,800 |
| 2019 | $7,825 | $207,000 | $70,200 | $136,800 |
| 2018 | $7,725 | $207,000 | $70,200 | $136,800 |
| 2017 | $7,024 | $188,200 | $66,900 | $121,300 |
| 2016 | $7,024 | $188,200 | $66,900 | $121,300 |
| 2015 | $7,061 | $188,200 | $66,900 | $121,300 |
| 2014 | $7,266 | $188,200 | $66,900 | $121,300 |
| 2013 | $8,525 | $216,700 | $66,900 | $149,800 |
Source: Public Records
Map
Nearby Homes