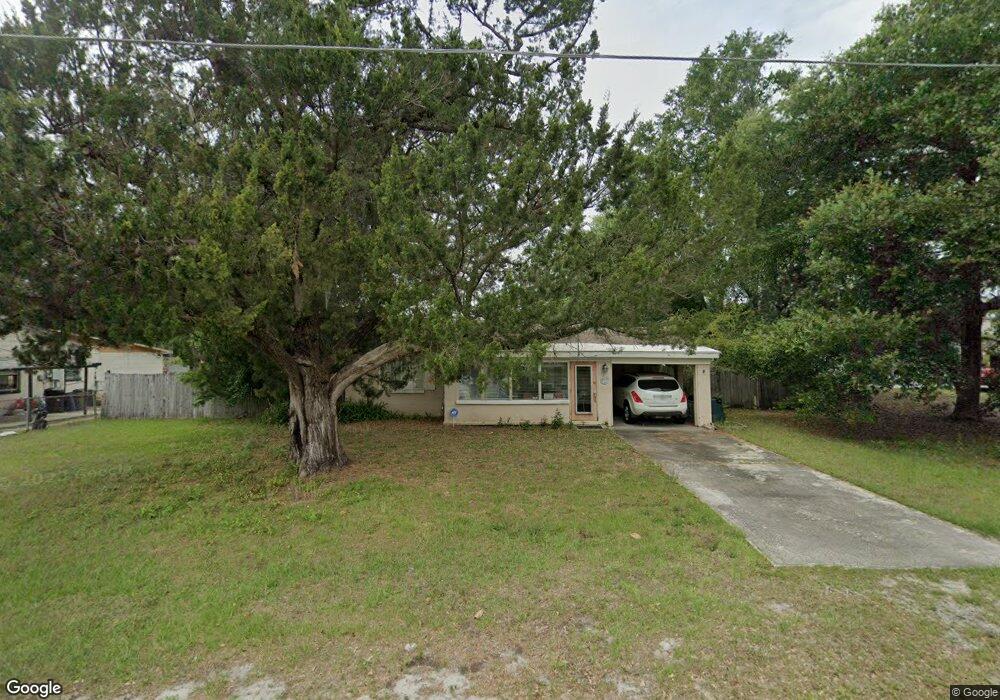
46 Naranja Rd Debary, FL 32713
Plantation Estates NeighborhoodEstimated Value: $181,000 - $229,000
2
Beds
1
Bath
876
Sq Ft
$233/Sq Ft
Est. Value
About This Home
This home is located at 46 Naranja Rd, Debary, FL 32713 and is currently estimated at $203,859, approximately $232 per square foot. 46 Naranja Rd is a home located in Volusia County with nearby schools including Enterprise Elementary School, River Springs Middle School, and University High School.
Ownership History
Date
Name
Owned For
Owner Type
Purchase Details
Closed on
Mar 30, 2001
Sold by
Ferrell Diana M and Ferrell Diane M
Bought by
Belangia Gayle L
Current Estimated Value
Home Financials for this Owner
Home Financials are based on the most recent Mortgage that was taken out on this home.
Original Mortgage
$46,325
Outstanding Balance
$16,345
Interest Rate
7.11%
Estimated Equity
$187,514
Purchase Details
Closed on
Apr 16, 1998
Sold by
Christy David and Christy Donelda
Bought by
Ferrel Diana M and Ferrell Diane M
Home Financials for this Owner
Home Financials are based on the most recent Mortgage that was taken out on this home.
Original Mortgage
$39,500
Interest Rate
7.09%
Purchase Details
Closed on
May 1, 1997
Sold by
Hillis Michael
Bought by
Christy David and Christy Donelda
Purchase Details
Closed on
Jan 27, 1997
Sold by
Beard Norman and Beard Naomi
Bought by
Hillis Michael
Create a Home Valuation Report for This Property
The Home Valuation Report is an in-depth analysis detailing your home's value as well as a comparison with similar homes in the area
Home Values in the Area
Average Home Value in this Area
Purchase History
| Date | Buyer | Sale Price | Title Company |
|---|---|---|---|
| Belangia Gayle L | $54,500 | -- | |
| Ferrel Diana M | $49,000 | -- | |
| Christy David | $45,000 | -- | |
| Hillis Michael | -- | -- |
Source: Public Records
Mortgage History
| Date | Status | Borrower | Loan Amount |
|---|---|---|---|
| Open | Belangia Gayle L | $46,325 | |
| Previous Owner | Ferrel Diana M | $39,500 |
Source: Public Records
Tax History
| Year | Tax Paid | Tax Assessment Tax Assessment Total Assessment is a certain percentage of the fair market value that is determined by local assessors to be the total taxable value of land and additions on the property. | Land | Improvement |
|---|---|---|---|---|
| 2026 | $2,447 | $156,780 | $58,581 | $98,199 |
| 2025 | $2,447 | $156,780 | $58,581 | $98,199 |
| 2024 | $2,113 | $156,279 | $57,175 | $99,104 |
| 2023 | $2,113 | $147,680 | $52,489 | $95,191 |
| 2022 | $1,905 | $123,002 | $36,086 | $86,916 |
| 2021 | $1,786 | $97,363 | $29,994 | $67,369 |
| 2020 | $1,665 | $84,813 | $22,495 | $62,318 |
| 2019 | $1,674 | $81,629 | $24,597 | $57,032 |
| 2018 | $1,544 | $74,782 | $20,885 | $53,897 |
| 2017 | $1,431 | $61,471 | $16,307 | $45,164 |
| 2016 | $1,280 | $50,457 | $0 | $0 |
| 2015 | $1,207 | $43,093 | $0 | $0 |
| 2014 | $1,118 | $43,167 | $0 | $0 |
Source: Public Records
Map
Nearby Homes
- 48 Naranja Rd
- 40 Naranja Rd
- 43 Naranja Rd
- 45 Naranja Rd
- 41 Naranja Rd
- 38 Naranja Rd
- 49 Naranja Rd
- 51 S Charles Richard Beall Blvd
- 36 Naranja Rd
- 104 2nd St
- 38 Alicante Rd
- 47 S Us Hwy 17-92
- 42 Alicante Rd
- 54 Naranja Rd
- 101 W 2nd St
- 42 S Us Hwy 17-92
- 46 Alicante Rd
- 103 2nd St
- 34 Naranja Rd
- 40 Alicante Rd
Your Personal Tour Guide
Ask me questions while you tour the home.