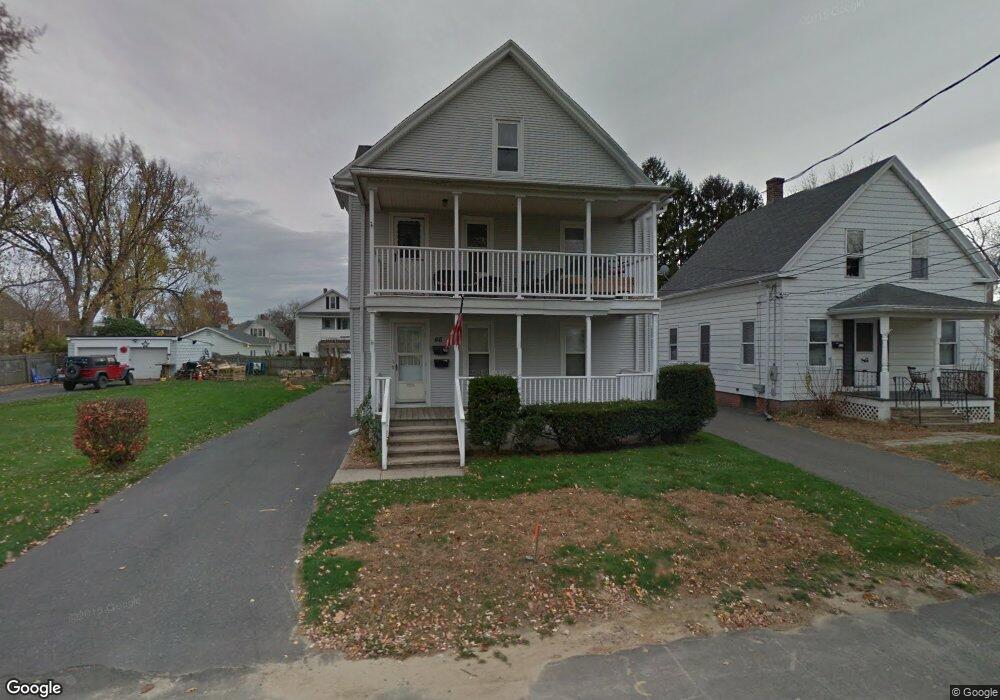
46 Nash St Chicopee, MA 01013
Willimansett NeighborhoodEstimated Value: $346,111 - $414,000
5
Beds
2
Baths
2,500
Sq Ft
$149/Sq Ft
Est. Value
About This Home
This home is located at 46 Nash St, Chicopee, MA 01013 and is currently estimated at $373,528, approximately $149 per square foot. 46 Nash St is a home located in Hampden County with nearby schools including Fairview Elementary School, Bellamy Middle School, and Chicopee Comprehensive High School.
Ownership History
Date
Name
Owned For
Owner Type
Purchase Details
Closed on
Aug 30, 1996
Sold by
Tokarski Stanley J and Tokarski Virginia A
Bought by
Edgerton Mark G and Edgerton Patricia R
Current Estimated Value
Home Financials for this Owner
Home Financials are based on the most recent Mortgage that was taken out on this home.
Original Mortgage
$90,630
Interest Rate
8.18%
Mortgage Type
Purchase Money Mortgage
Purchase Details
Closed on
Aug 5, 1988
Sold by
Mrozinski Walter L
Bought by
Tokarski Stanley
Create a Home Valuation Report for This Property
The Home Valuation Report is an in-depth analysis detailing your home's value as well as a comparison with similar homes in the area
Home Values in the Area
Average Home Value in this Area
Purchase History
| Date | Buyer | Sale Price | Title Company |
|---|---|---|---|
| Edgerton Mark G | $95,400 | -- | |
| Tokarski Stanley | $55,000 | -- |
Source: Public Records
Mortgage History
| Date | Status | Borrower | Loan Amount |
|---|---|---|---|
| Open | Tokarski Stanley | $121,000 | |
| Closed | Tokarski Stanley | $11,455 | |
| Closed | Tokarski Stanley | $90,630 |
Source: Public Records
Tax History
| Year | Tax Paid | Tax Assessment Tax Assessment Total Assessment is a certain percentage of the fair market value that is determined by local assessors to be the total taxable value of land and additions on the property. | Land | Improvement |
|---|---|---|---|---|
| 2025 | $4,701 | $310,100 | $101,600 | $208,500 |
| 2024 | $4,449 | $301,400 | $99,600 | $201,800 |
| 2023 | $4,154 | $274,200 | $90,500 | $183,700 |
| 2022 | $4,064 | $239,200 | $78,700 | $160,500 |
| 2021 | $3,855 | $218,900 | $71,600 | $147,300 |
| 2020 | $3,647 | $208,900 | $71,600 | $137,300 |
| 2019 | $3,569 | $198,700 | $71,600 | $127,100 |
| 2018 | $3,484 | $190,300 | $68,200 | $122,100 |
| 2017 | $3,232 | $186,700 | $68,200 | $118,500 |
| 2016 | $2,951 | $174,500 | $68,200 | $106,300 |
| 2015 | $3,182 | $181,400 | $68,200 | $113,200 |
| 2014 | $1,591 | $181,400 | $68,200 | $113,200 |
Source: Public Records
Map
Nearby Homes
Your Personal Tour Guide
Ask me questions while you tour the home.