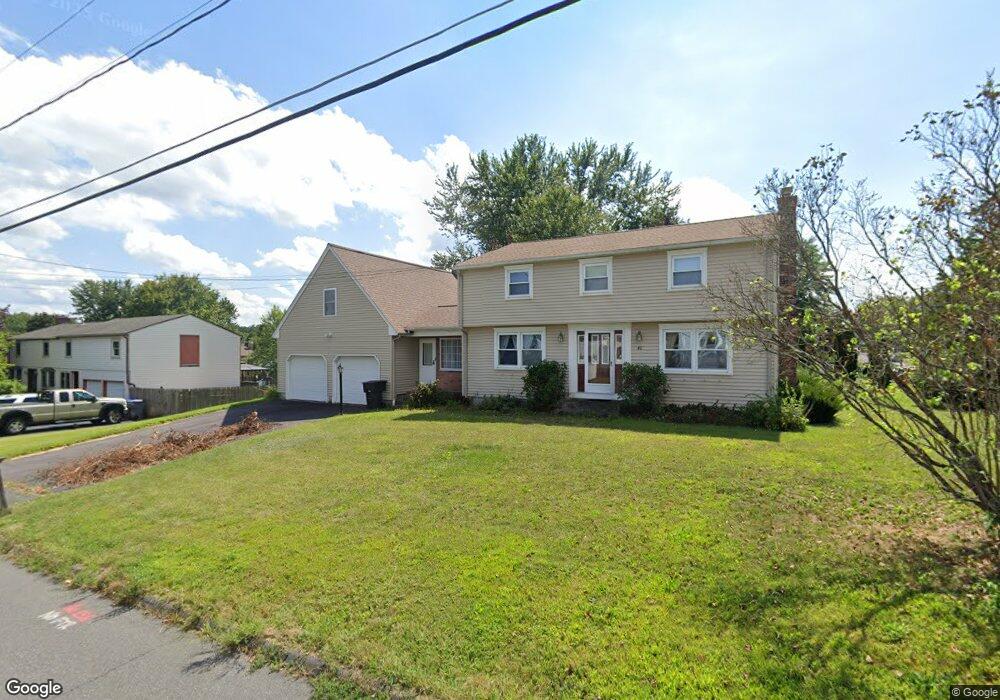
46 Neelans Rd Enfield, CT 06082
Estimated Value: $383,646 - $409,000
4
Beds
2
Baths
1,906
Sq Ft
$209/Sq Ft
Est. Value
About This Home
This home is located at 46 Neelans Rd, Enfield, CT 06082 and is currently estimated at $397,662, approximately $208 per square foot. 46 Neelans Rd is a home located in Hartford County with nearby schools including Edgar H. Parkman School, Nathan Hale Elementary School, and John F. Kennedy Middle School.
Ownership History
Date
Name
Owned For
Owner Type
Purchase Details
Closed on
Sep 17, 2010
Sold by
Cipollini Ned
Bought by
Moore Colin
Current Estimated Value
Home Financials for this Owner
Home Financials are based on the most recent Mortgage that was taken out on this home.
Original Mortgage
$190,000
Outstanding Balance
$125,908
Interest Rate
4.51%
Estimated Equity
$271,754
Purchase Details
Closed on
Dec 15, 1993
Sold by
Davidson Herbert
Bought by
Cipollini Ned
Home Financials for this Owner
Home Financials are based on the most recent Mortgage that was taken out on this home.
Original Mortgage
$91,950
Interest Rate
4.1%
Mortgage Type
Unknown
Create a Home Valuation Report for This Property
The Home Valuation Report is an in-depth analysis detailing your home's value as well as a comparison with similar homes in the area
Home Values in the Area
Average Home Value in this Area
Purchase History
| Date | Buyer | Sale Price | Title Company |
|---|---|---|---|
| Moore Colin | $237,500 | -- | |
| Cipollini Ned | $114,900 | -- |
Source: Public Records
Mortgage History
| Date | Status | Borrower | Loan Amount |
|---|---|---|---|
| Open | Cipollini Ned | $190,000 | |
| Previous Owner | Cipollini Ned | $91,950 |
Source: Public Records
Tax History Compared to Growth
Tax History
| Year | Tax Paid | Tax Assessment Tax Assessment Total Assessment is a certain percentage of the fair market value that is determined by local assessors to be the total taxable value of land and additions on the property. | Land | Improvement |
|---|---|---|---|---|
| 2025 | $6,438 | $184,000 | $59,100 | $124,900 |
| 2024 | $6,265 | $184,000 | $59,100 | $124,900 |
| 2023 | $6,219 | $184,000 | $59,100 | $124,900 |
| 2022 | $5,647 | $184,000 | $59,100 | $124,900 |
| 2021 | $5,939 | $158,240 | $50,970 | $107,270 |
| 2020 | $5,939 | $158,240 | $50,970 | $107,270 |
| 2019 | $5,955 | $158,240 | $50,970 | $107,270 |
| 2018 | $5,855 | $158,240 | $50,970 | $107,270 |
| 2017 | $5,527 | $158,240 | $50,970 | $107,270 |
| 2016 | $5,678 | $165,480 | $50,970 | $114,510 |
| 2015 | $5,501 | $165,480 | $50,970 | $114,510 |
| 2014 | $5,358 | $165,480 | $50,970 | $114,510 |
Source: Public Records
Map
Nearby Homes