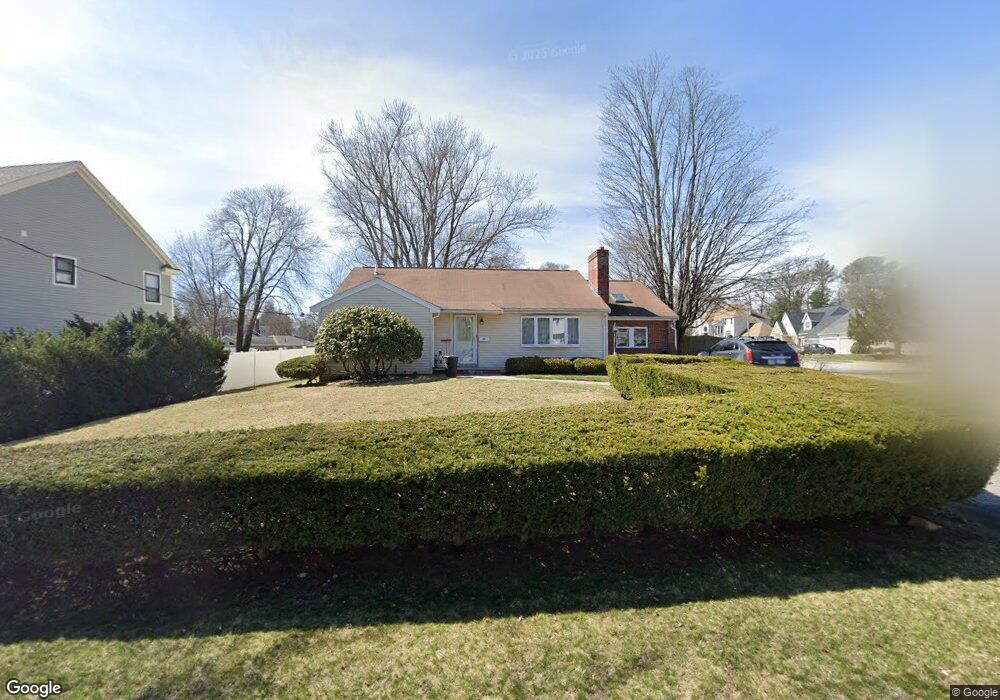
46 Oak St Stoneham, MA 02180
Lindenwood NeighborhoodEstimated Value: $712,000 - $817,000
2
Beds
2
Baths
1,711
Sq Ft
$452/Sq Ft
Est. Value
About This Home
This home is located at 46 Oak St, Stoneham, MA 02180 and is currently estimated at $772,623, approximately $451 per square foot. 46 Oak St is a home located in Middlesex County with nearby schools including Stoneham High School, St. Patrick Elementary School, and Greater Boston Academy.
Ownership History
Date
Name
Owned For
Owner Type
Purchase Details
Closed on
Jan 17, 1997
Sold by
Donaher Joseph and Donaher Ann M
Bought by
Pacheco Larry S and Pacheco Karen S
Current Estimated Value
Purchase Details
Closed on
May 26, 1995
Sold by
Donaher Joseph and Donaher Ann M
Bought by
Robin Hood Rt and Barons Mark D
Purchase Details
Closed on
Nov 30, 1992
Sold by
Donaher Joseph and Donaher Joann
Bought by
Donaher Joseph and Donaher Ann M
Create a Home Valuation Report for This Property
The Home Valuation Report is an in-depth analysis detailing your home's value as well as a comparison with similar homes in the area
Home Values in the Area
Average Home Value in this Area
Purchase History
| Date | Buyer | Sale Price | Title Company |
|---|---|---|---|
| Pacheco Larry S | $166,000 | -- | |
| Robin Hood Rt | $13,500 | -- | |
| Donaher Joseph | $20,000 | -- |
Source: Public Records
Mortgage History
| Date | Status | Borrower | Loan Amount |
|---|---|---|---|
| Open | Donaher Joseph | $322,000 | |
| Closed | Donaher Joseph | $20,000 |
Source: Public Records
Tax History
| Year | Tax Paid | Tax Assessment Tax Assessment Total Assessment is a certain percentage of the fair market value that is determined by local assessors to be the total taxable value of land and additions on the property. | Land | Improvement |
|---|---|---|---|---|
| 2025 | $7,674 | $750,100 | $381,400 | $368,700 |
| 2024 | $7,331 | $692,300 | $351,400 | $340,900 |
| 2023 | $7,187 | $647,500 | $321,400 | $326,100 |
| 2022 | $6,345 | $609,500 | $301,400 | $308,100 |
| 2021 | $5,312 | $572,400 | $281,400 | $291,000 |
| 2020 | $6,190 | $573,700 | $281,400 | $292,300 |
| 2019 | $6,030 | $537,400 | $261,400 | $276,000 |
| 2018 | $4,847 | $495,700 | $231,400 | $264,300 |
| 2017 | $5,994 | $483,800 | $231,400 | $252,400 |
| 2016 | $5,236 | $412,300 | $216,400 | $195,900 |
| 2015 | $5,145 | $397,000 | $216,400 | $180,600 |
| 2014 | $4,866 | $360,700 | $171,400 | $189,300 |
Source: Public Records
Map
Nearby Homes
- 159 Main St Unit 47C
- 159 Main St Unit 52B
- 159 Main St Unit 11B
- 66 Main St Unit 48A
- 66 Main St Unit 47A
- 11 Isola Ln
- 62 High St Unit Lot 7
- 100 Ledgewood Dr Unit 410
- 106 Elm St
- 2 Pine St Unit 3
- 7 Pine St
- 57 Augustus Ct Unit 1010
- 39 Chestnut St Unit 2C
- 36 Augustus Ct Unit 2012
- 426 Main St Unit 205
- 84 Curtis St
- 6 Stratton Dr Unit 3303
- 472 Main St Unit C
- 6 Everett St
- 33 Old Farm Rd
Your Personal Tour Guide
Ask me questions while you tour the home.