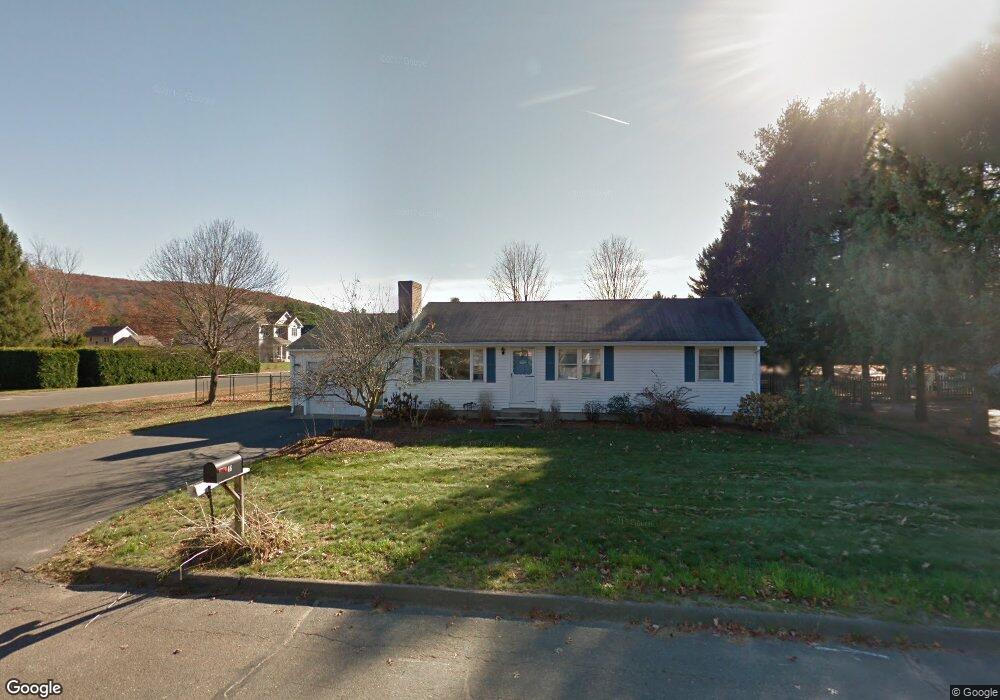
46 Overlook Dr Easthampton, MA 01027
Estimated Value: $368,000 - $428,000
3
Beds
3
Baths
1,144
Sq Ft
$341/Sq Ft
Est. Value
About This Home
This home is located at 46 Overlook Dr, Easthampton, MA 01027 and is currently estimated at $389,851, approximately $340 per square foot. 46 Overlook Dr is a home located in Hampshire County with nearby schools including Easthampton High School, Calvary Baptist Christian School, and Tri-County Schools.
Ownership History
Date
Name
Owned For
Owner Type
Purchase Details
Closed on
Oct 24, 1991
Sold by
Dachos Timothy J and Dachos Mary Ellen
Bought by
Smith Dawn C
Current Estimated Value
Home Financials for this Owner
Home Financials are based on the most recent Mortgage that was taken out on this home.
Original Mortgage
$50,000
Interest Rate
8.98%
Mortgage Type
Purchase Money Mortgage
Create a Home Valuation Report for This Property
The Home Valuation Report is an in-depth analysis detailing your home's value as well as a comparison with similar homes in the area
Home Values in the Area
Average Home Value in this Area
Purchase History
| Date | Buyer | Sale Price | Title Company |
|---|---|---|---|
| Smith Dawn C | $120,500 | -- |
Source: Public Records
Mortgage History
| Date | Status | Borrower | Loan Amount |
|---|---|---|---|
| Closed | Smith Dawn C | $50,000 | |
| Previous Owner | Smith Dawn C | $20,000 |
Source: Public Records
Tax History
| Year | Tax Paid | Tax Assessment Tax Assessment Total Assessment is a certain percentage of the fair market value that is determined by local assessors to be the total taxable value of land and additions on the property. | Land | Improvement |
|---|---|---|---|---|
| 2025 | $4,499 | $329,100 | $121,300 | $207,800 |
| 2024 | $4,345 | $320,400 | $118,000 | $202,400 |
| 2023 | $3,569 | $243,600 | $93,200 | $150,400 |
| 2022 | $4,027 | $243,600 | $93,200 | $150,400 |
| 2021 | $4,406 | $251,200 | $93,200 | $158,000 |
| 2020 | $4,326 | $243,600 | $93,200 | $150,400 |
| 2019 | $3,624 | $234,400 | $93,200 | $141,200 |
| 2018 | $3,470 | $216,900 | $87,800 | $129,100 |
| 2017 | $3,385 | $208,800 | $84,300 | $124,500 |
| 2016 | $3,255 | $208,800 | $84,300 | $124,500 |
| 2015 | $3,163 | $208,800 | $84,300 | $124,500 |
Source: Public Records
Map
Nearby Homes
Your Personal Tour Guide
Ask me questions while you tour the home.