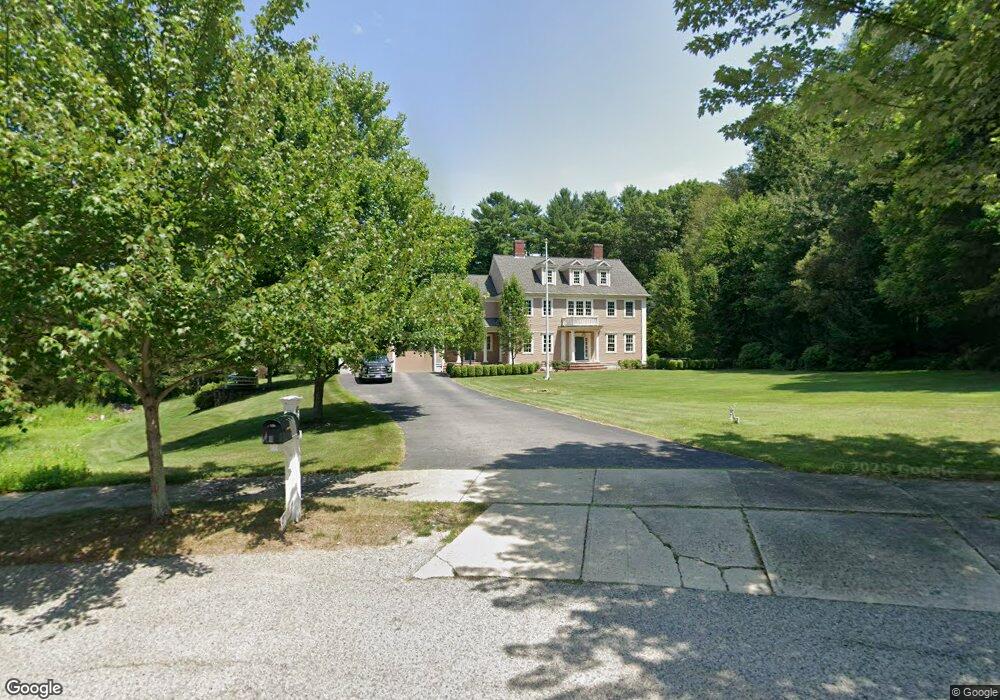
46 Paddock Way Marshfield, MA 02050
Estimated Value: $1,382,000 - $1,675,000
4
Beds
4
Baths
4,566
Sq Ft
$328/Sq Ft
Est. Value
About This Home
This home is located at 46 Paddock Way, Marshfield, MA 02050 and is currently estimated at $1,496,028, approximately $327 per square foot. 46 Paddock Way is a home located in Plymouth County with nearby schools including Martinson Elementary School, Furnace Brook Middle School, and Marshfield High School.
Ownership History
Date
Name
Owned For
Owner Type
Purchase Details
Closed on
Feb 24, 2015
Sold by
Donovan Brian J
Bought by
Brian J Donovan Ft and Donovan Brian J
Current Estimated Value
Purchase Details
Closed on
Jun 2, 2000
Sold by
Carriage House Acres
Bought by
Donovan Brian J
Create a Home Valuation Report for This Property
The Home Valuation Report is an in-depth analysis detailing your home's value as well as a comparison with similar homes in the area
Home Values in the Area
Average Home Value in this Area
Purchase History
| Date | Buyer | Sale Price | Title Company |
|---|---|---|---|
| Brian J Donovan Ft | -- | -- | |
| Donovan Brian J | $175,000 | -- |
Source: Public Records
Mortgage History
| Date | Status | Borrower | Loan Amount |
|---|---|---|---|
| Previous Owner | Donovan Brian J | $150,000 |
Source: Public Records
Tax History
| Year | Tax Paid | Tax Assessment Tax Assessment Total Assessment is a certain percentage of the fair market value that is determined by local assessors to be the total taxable value of land and additions on the property. | Land | Improvement |
|---|---|---|---|---|
| 2025 | $13,975 | $1,411,600 | $373,600 | $1,038,000 |
| 2024 | $13,544 | $1,303,600 | $351,800 | $951,800 |
| 2023 | $12,831 | $1,149,500 | $316,600 | $832,900 |
| 2022 | $12,831 | $990,800 | $264,100 | $726,700 |
| 2021 | $12,106 | $917,800 | $264,100 | $653,700 |
| 2020 | $11,990 | $899,500 | $264,100 | $635,400 |
| 2019 | $11,547 | $863,000 | $264,100 | $598,900 |
| 2018 | $10,590 | $792,100 | $264,100 | $528,000 |
| 2017 | $10,014 | $729,900 | $231,400 | $498,500 |
| 2016 | $9,669 | $696,600 | $231,400 | $465,200 |
| 2015 | $9,109 | $685,400 | $231,400 | $454,000 |
| 2014 | $9,517 | $716,100 | $231,400 | $484,700 |
Source: Public Records
Map
Nearby Homes
- 1 Valley Path
- 480 Pleasant St
- 32 Carolyn Cir
- 95 Stony Brook Ln
- 1155 Main St
- 60 Samuel Curtis Way
- 3 Harbor Ln
- 889 Old Main Street Extension
- 422 River St
- 55 Macombers Way
- 75 Masthead Dr
- 26 Damons Point Cir
- 9 Cushing Park Rd
- 10 Royal Dane Dr Unit 85
- 5 Royal Dane Dr Unit 45
- 451 School St Unit 2-5
- 451 School St Unit 5-2
- 848 Plain St Unit 41
- 848 Plain St Unit 23
- 138 Judge Cushing Rd
Your Personal Tour Guide
Ask me questions while you tour the home.