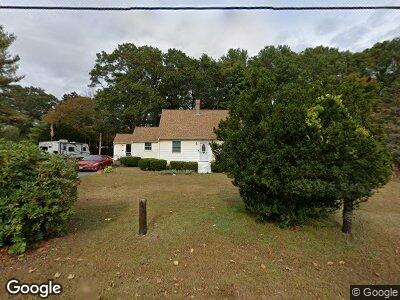
46 Plymouth Rd Hanover, MA 02339
Estimated Value: $613,641 - $642,000
4
Beds
2
Baths
1,440
Sq Ft
$436/Sq Ft
Est. Value
About This Home
This home is located at 46 Plymouth Rd, Hanover, MA 02339 and is currently estimated at $628,160, approximately $436 per square foot. 46 Plymouth Rd is a home located in Plymouth County with nearby schools including Hanover High School, Cadence Academy Preschool - Hanover, and Cardinal Cushing Centers.
Ownership History
Date
Name
Owned For
Owner Type
Purchase Details
Closed on
Jun 5, 2015
Sold by
Pascarelli Mark J
Bought by
Mark J Pascarelli Lt
Current Estimated Value
Purchase Details
Closed on
Sep 2, 1999
Sold by
Pascarelli Alfonso R
Bought by
Pascarelli Mark J
Create a Home Valuation Report for This Property
The Home Valuation Report is an in-depth analysis detailing your home's value as well as a comparison with similar homes in the area
Home Values in the Area
Average Home Value in this Area
Purchase History
| Date | Buyer | Sale Price | Title Company |
|---|---|---|---|
| Mark J Pascarelli Lt | -- | -- | |
| Pascarelli Mark J | $175,000 | -- |
Source: Public Records
Mortgage History
| Date | Status | Borrower | Loan Amount |
|---|---|---|---|
| Previous Owner | Pascarelli Mark J | $50,000 | |
| Previous Owner | Pascarelli Mark J | $132,768 | |
| Previous Owner | Pascarelli Mark J | $132,768 | |
| Previous Owner | Pascarelli Mark J | $135,500 |
Source: Public Records
Tax History Compared to Growth
Tax History
| Year | Tax Paid | Tax Assessment Tax Assessment Total Assessment is a certain percentage of the fair market value that is determined by local assessors to be the total taxable value of land and additions on the property. | Land | Improvement |
|---|---|---|---|---|
| 2025 | $6,323 | $512,000 | $269,600 | $242,400 |
| 2024 | $6,233 | $485,400 | $269,600 | $215,800 |
| 2023 | $5,874 | $435,400 | $245,100 | $190,300 |
| 2022 | $6,288 | $412,300 | $245,100 | $167,200 |
| 2021 | $6,207 | $380,100 | $211,600 | $168,500 |
| 2020 | $6,152 | $377,200 | $211,600 | $165,600 |
| 2019 | $5,830 | $355,300 | $211,600 | $143,700 |
| 2018 | $5,737 | $352,400 | $211,600 | $140,800 |
| 2017 | $5,471 | $331,200 | $210,000 | $121,200 |
| 2016 | $5,311 | $315,000 | $191,000 | $124,000 |
| 2015 | -- | $309,400 | $191,000 | $118,400 |
Source: Public Records
Map
Nearby Homes