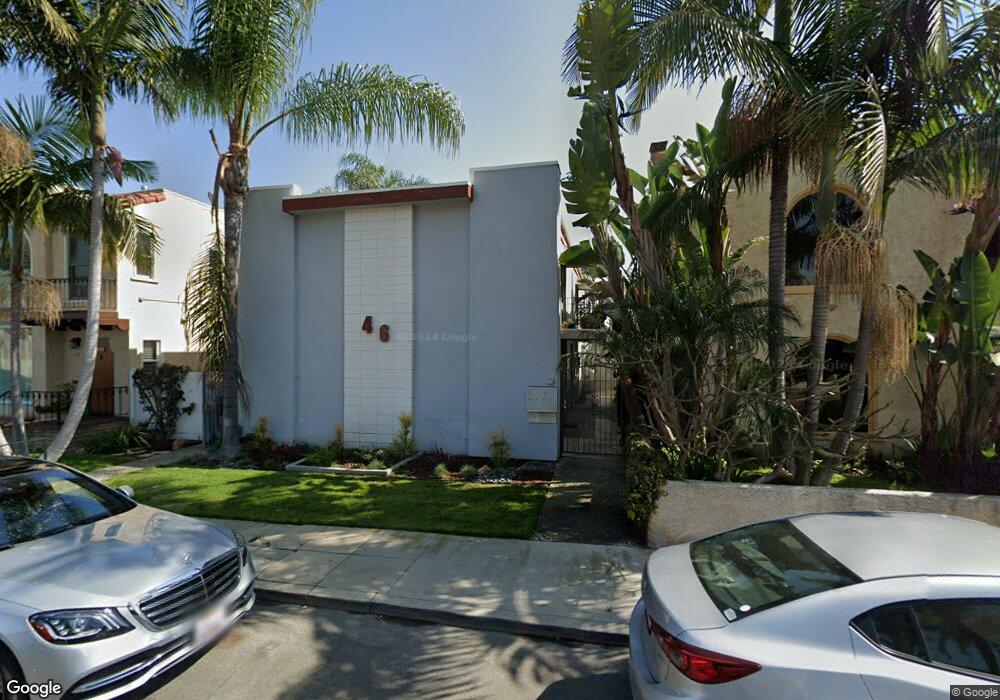
46 Quincy Ave Long Beach, CA 90803
Belmont Shore NeighborhoodEstimated Value: $1,315,000 - $2,117,000
5
Beds
5
Baths
2,950
Sq Ft
$600/Sq Ft
Est. Value
About This Home
This home is located at 46 Quincy Ave, Long Beach, CA 90803 and is currently estimated at $1,769,273, approximately $599 per square foot. 46 Quincy Ave is a home located in Los Angeles County with nearby schools including Lowell Elementary School, Rogers Middle School, and Woodrow Wilson High School.
Ownership History
Date
Name
Owned For
Owner Type
Purchase Details
Closed on
Dec 5, 2016
Sold by
Miller Carl R and Miller Stefanie V
Bought by
Miller Carl R and Miller Stefanie V
Current Estimated Value
Purchase Details
Closed on
Dec 2, 1997
Sold by
Bender Leland and Bender Bonnie
Bought by
Miller Carl R and Miller Stefanie V
Home Financials for this Owner
Home Financials are based on the most recent Mortgage that was taken out on this home.
Original Mortgage
$192,000
Interest Rate
6.98%
Create a Home Valuation Report for This Property
The Home Valuation Report is an in-depth analysis detailing your home's value as well as a comparison with similar homes in the area
Home Values in the Area
Average Home Value in this Area
Purchase History
| Date | Buyer | Sale Price | Title Company |
|---|---|---|---|
| Miller Carl R | -- | None Available | |
| Miller Carl R | $345,000 | -- |
Source: Public Records
Mortgage History
| Date | Status | Borrower | Loan Amount |
|---|---|---|---|
| Previous Owner | Miller Carl R | $192,000 |
Source: Public Records
Tax History
| Year | Tax Paid | Tax Assessment Tax Assessment Total Assessment is a certain percentage of the fair market value that is determined by local assessors to be the total taxable value of land and additions on the property. | Land | Improvement |
|---|---|---|---|---|
| 2025 | $7,493 | $550,853 | $237,900 | $312,953 |
| 2024 | $7,493 | $540,053 | $233,236 | $306,817 |
| 2023 | $7,362 | $529,464 | $228,663 | $300,801 |
| 2022 | $6,921 | $519,083 | $224,180 | $294,903 |
| 2021 | $6,766 | $508,906 | $219,785 | $289,121 |
| 2019 | $6,669 | $494,314 | $213,267 | $281,047 |
| 2018 | $6,481 | $484,633 | $209,086 | $275,547 |
| 2016 | $5,958 | $465,335 | $200,968 | $264,367 |
| 2015 | $5,726 | $458,346 | $197,950 | $260,396 |
| 2014 | $5,702 | $449,369 | $194,073 | $255,296 |
Source: Public Records
Map
Nearby Homes
- 70 Saint Joseph Ave
- 34 Ximeno Ave
- 28 Argonne Ave
- 75 Granada Ave
- 111 Ximeno Ave
- 4401 E Division St
- 24 Roswell Ave
- 132 Belmont Ave
- 116 Termino Ave
- 3939 E Allin St Unit 109
- 4527 E Shaw St
- 220 Granada Ave
- 66 Pomona Ave
- 173 Glendora Ave
- 223 Bennett Ave
- 16 38th Place
- 202 Mira Mar Ave
- 131 Santa Ana Ave
- 75 Claremont Ave
- 207 Mira Mar Ave
- 50 Quincy Ave
- 40 Quincy Ave
- 56 Quincy Ave
- 38 Quincy Ave
- 43 Roycroft Ave
- 45 Roycroft Ave
- 60 Quincy Ave
- 30 Quincy Ave
- 47 Roycroft Ave
- 35 Roycroft Ave
- 53 Roycroft Ave
- 31 Roycroft Ave
- 53 Quincy Ave
- 39 Quincy Ave
- 55 Quincy Ave
- 22 Quincy Ave
- 66 Quincy Ave
- 55 Roycroft Ave Unit 2A
- 55 Roycroft Ave Unit 1A
- 25 Roycroft Ave
Your Personal Tour Guide
Ask me questions while you tour the home.