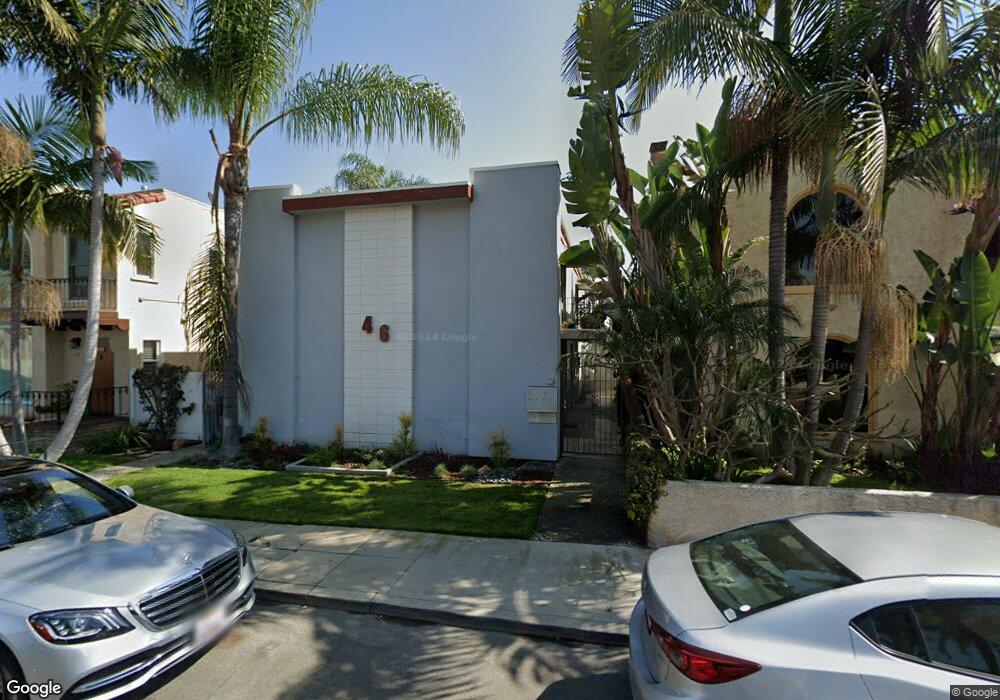
46 Quincy Ave Long Beach, CA 90803
Belmont Shore NeighborhoodEstimated Value: $1,436,000 - $1,821,929
About This Home
This home is located at 46 Quincy Ave, Long Beach, CA 90803 and is currently estimated at $1,615,232, approximately $547 per square foot. 46 Quincy Ave is a home located in Los Angeles County with nearby schools including Lowell Elementary School, Rogers Middle School, and Woodrow Wilson High School.
Ownership History
We collect this data history from publicly available records. To have your information removed, we recommend requesting removal directly through your county’s website.
Purchase Details
Purchase Details
Home Financials for this Owner
Home Financials are based on the most recent Mortgage that was taken out on this home.Home Values in the Area
Average Home Value in this Area
Purchase History
We collect this data history from publicly available records. To have your information removed, we recommend requesting removal directly through your county’s website.
| Date | Buyer | Sale Price | Title Company |
|---|---|---|---|
| -- | None Available | ||
| $345,000 | -- |
Mortgage History
We collect this data history from publicly available records. To have your information removed, we recommend requesting removal directly through your county’s website.
| Date | Status | Borrower | Loan Amount |
|---|---|---|---|
| Previous Owner | $192,000 |
Tax History
We collect this data history from publicly available records. To have your information removed, we recommend requesting removal directly through your county’s website.
| Year | Tax Paid | Tax Assessment Tax Assessment Total Assessment is a certain percentage of the fair market value that is determined by local assessors to be the total taxable value of land and additions on the property. | Land | Improvement |
|---|---|---|---|---|
| 2025 | $7,835 | $550,853 | $237,900 | $312,953 |
| 2024 | $7,493 | $540,053 | $233,236 | $306,817 |
| 2023 | $7,362 | $529,464 | $228,663 | $300,801 |
| 2022 | $6,921 | $519,083 | $224,180 | $294,903 |
| 2021 | $6,766 | $508,906 | $219,785 | $289,121 |
| 2019 | $6,669 | $494,314 | $213,267 | $281,047 |
| 2018 | $6,481 | $484,633 | $209,086 | $275,547 |
| 2016 | $5,958 | $465,335 | $200,968 | $264,367 |
| 2015 | $5,726 | $458,346 | $197,950 | $260,396 |
| 2014 | $5,702 | $449,369 | $194,073 | $255,296 |
Map
- 70 Roycroft Ave
- 20 Roycroft Ave
- 4821 E Ocean Blvd Unit AB
- 104 Saint Joseph Ave
- 4915 E Ocean Blvd
- 40 Ximeno Ave
- 28 Argonne Ave
- 74 Argonne Ave
- 114 Argonne Ave
- 152 Park Ave
- 60 Bennett Ave
- 4401 E Division St
- 110 Bennett Ave
- 25 Bennett Ave
- 170 Park Ave
- 134 Bennett Ave
- 153 Granada Ave
- 170 Saint Joseph Ave
- 185 Quincy Ave Unit 202
- 105 Roswell Ave
- 48 Roycroft Ave
- 54 Roycroft Ave
- 44 Roycroft Ave
- 60 Roycroft Ave
- 40 Roycroft Ave
- 38 Roycroft Ave
- 47 Park Ave
- 55 Park Ave
- 64 Roycroft Ave
- 43 Park Ave
- 32 Roycroft Ave
- 59 Park Ave
- 37 Park Ave
- 47 Roycroft Ave
- 45 Roycroft Ave
- 53 Roycroft Ave
- 43 Roycroft Ave
- 70 Roycroft Ave Unit A
- 28 Roycroft Ave
- 31 Park Ave
Ask me questions while you tour the home.