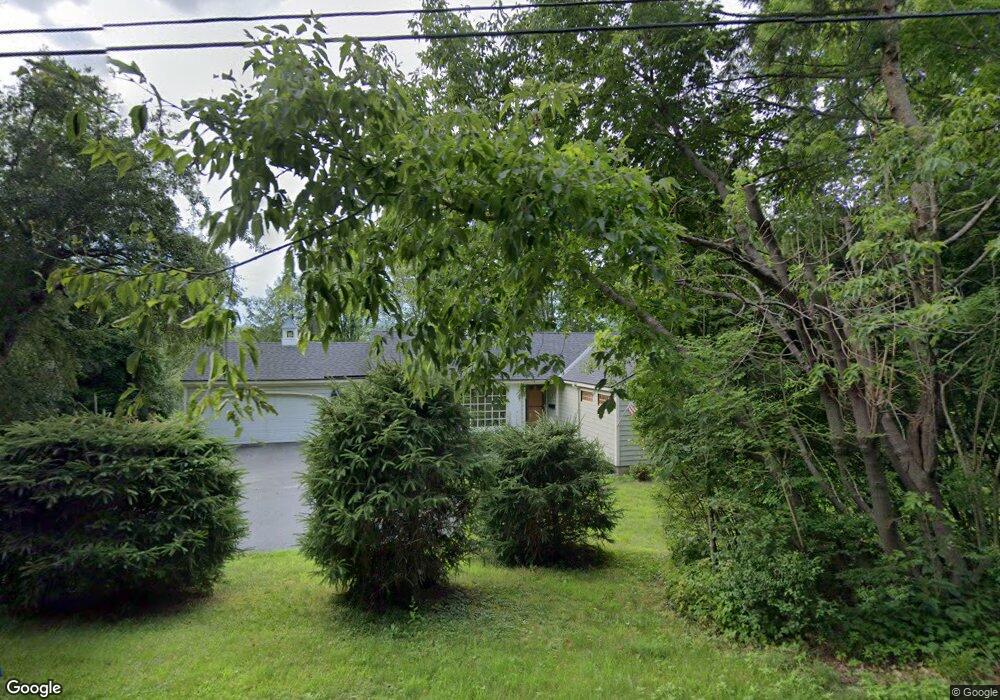
46 Rip Rd Hanover, NH 03755
Estimated Value: $886,206 - $1,243,000
3
Beds
2
Baths
1,488
Sq Ft
$708/Sq Ft
Est. Value
About This Home
This home is located at 46 Rip Rd, Hanover, NH 03755 and is currently estimated at $1,053,552, approximately $708 per square foot. 46 Rip Rd is a home located in Grafton County with nearby schools including Bernice A. Ray School, Frances C. Richmond School, and Hanover High School.
Ownership History
Date
Name
Owned For
Owner Type
Purchase Details
Closed on
Jan 14, 2021
Sold by
Brighton Susan C
Bought by
Brighton John M and Brighton Susan C
Current Estimated Value
Home Financials for this Owner
Home Financials are based on the most recent Mortgage that was taken out on this home.
Original Mortgage
$230,000
Outstanding Balance
$203,234
Interest Rate
2.67%
Mortgage Type
New Conventional
Estimated Equity
$850,318
Purchase Details
Closed on
Sep 8, 2009
Sold by
Linell Marjorie A Est and Linell
Bought by
Brighton John M and Brighton Susan C
Home Financials for this Owner
Home Financials are based on the most recent Mortgage that was taken out on this home.
Original Mortgage
$313,600
Interest Rate
5.21%
Mortgage Type
Purchase Money Mortgage
Create a Home Valuation Report for This Property
The Home Valuation Report is an in-depth analysis detailing your home's value as well as a comparison with similar homes in the area
Home Values in the Area
Average Home Value in this Area
Purchase History
| Date | Buyer | Sale Price | Title Company |
|---|---|---|---|
| Brighton John M | -- | None Available | |
| Brighton John M | -- | None Available | |
| Brighton John M | -- | None Available | |
| Brighton John M | $392,000 | -- | |
| Brighton John M | $392,000 | -- |
Source: Public Records
Mortgage History
| Date | Status | Borrower | Loan Amount |
|---|---|---|---|
| Open | Brighton John M | $230,000 | |
| Closed | Brighton John M | $230,000 | |
| Previous Owner | Brighton John M | $346,800 | |
| Previous Owner | Brighton John M | $313,600 | |
| Previous Owner | Brighton John M | $40,000 |
Source: Public Records
Tax History
| Year | Tax Paid | Tax Assessment Tax Assessment Total Assessment is a certain percentage of the fair market value that is determined by local assessors to be the total taxable value of land and additions on the property. | Land | Improvement |
|---|---|---|---|---|
| 2024 | $13,761 | $714,100 | $389,400 | $324,700 |
| 2023 | $13,239 | $714,100 | $389,400 | $324,700 |
| 2022 | $12,704 | $714,100 | $389,400 | $324,700 |
| 2021 | $12,597 | $714,100 | $389,400 | $324,700 |
| 2020 | $11,113 | $549,900 | $351,000 | $198,900 |
| 2019 | $10,960 | $549,900 | $351,000 | $198,900 |
| 2018 | $10,575 | $549,900 | $351,000 | $198,900 |
| 2017 | $10,342 | $476,800 | $230,700 | $246,100 |
| 2016 | $10,151 | $476,800 | $230,700 | $246,100 |
| 2015 | $9,956 | $476,800 | $230,700 | $246,100 |
| 2014 | $9,550 | $476,800 | $230,700 | $246,100 |
| 2013 | $9,207 | $476,800 | $230,700 | $246,100 |
| 2012 | $8,370 | $452,700 | $215,400 | $237,300 |
Source: Public Records
Map
Nearby Homes
- 25 Hemlock Rd
- 3 Woodmore Dr
- 53 Lyme Rd Unit 35
- 68 Lyme Rd
- 0 and 2.5 Balch Hill Ln
- 4 Haskins Rd
- 2 Hilton Field Ln
- 51 Loveland Rd
- 0 U S 5
- 15 Melview Ridge
- 4 Occom Ridge
- 201 Hawk Pine Rd
- 1 O'Leary Ave
- 15 College Hill
- 27 College Hill Rd
- 16 College Hill Rd
- 85 Lebanon St
- 23 School St
- 207 Willey Hill Rd
- 11 Gile Dr Unit 1B
Your Personal Tour Guide
Ask me questions while you tour the home.