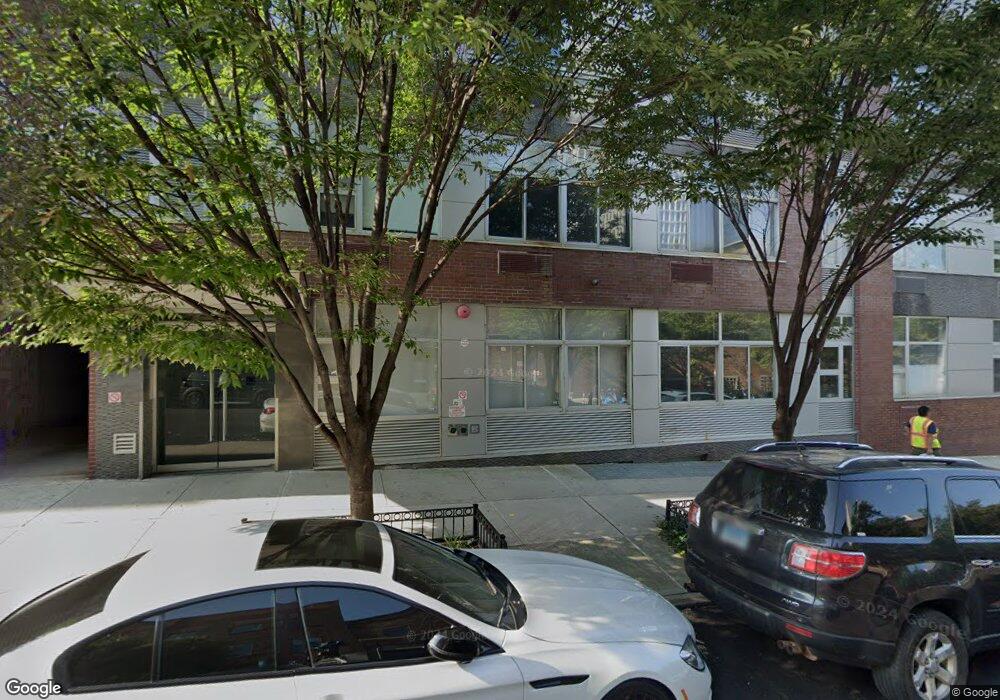
46 S 2 Nd St Unit 4 C New York City, NY 11249
Williamsburg NeighborhoodEstimated Value: $1,157,000 - $1,665,000
--
Bed
2
Baths
794
Sq Ft
$1,766/Sq Ft
Est. Value
About This Home
This home is located at 46 S 2 Nd St Unit 4 C, New York City, NY 11249 and is currently estimated at $1,401,983, approximately $1,765 per square foot. 46 S 2 Nd St Unit 4 C is a home located in Kings County with nearby schools including P.S. 84 Jose De Diego, Success Academy Williamsburg, and Williamsburg Montessori.
Ownership History
Date
Name
Owned For
Owner Type
Purchase Details
Closed on
Aug 16, 2019
Sold by
Siegmund Mark and Yang Tzu-I Jonathan
Bought by
Martadarma Prabenzo
Current Estimated Value
Home Financials for this Owner
Home Financials are based on the most recent Mortgage that was taken out on this home.
Original Mortgage
$1,120,000
Outstanding Balance
$980,913
Interest Rate
3.7%
Mortgage Type
Unknown
Estimated Equity
$421,070
Purchase Details
Closed on
May 24, 2016
Sold by
Cotler Samuel A
Bought by
Siegmund Mark and Yang Tzu-I Jonathan
Home Financials for this Owner
Home Financials are based on the most recent Mortgage that was taken out on this home.
Original Mortgage
$1,032,440
Interest Rate
3.66%
Mortgage Type
Unknown
Purchase Details
Closed on
Jul 13, 2011
Sold by
291 Kent Properties Llc
Bought by
Cotler Samuel A
Home Financials for this Owner
Home Financials are based on the most recent Mortgage that was taken out on this home.
Original Mortgage
$218,000
Interest Rate
4.52%
Mortgage Type
Purchase Money Mortgage
Create a Home Valuation Report for This Property
The Home Valuation Report is an in-depth analysis detailing your home's value as well as a comparison with similar homes in the area
Home Values in the Area
Average Home Value in this Area
Purchase History
| Date | Buyer | Sale Price | Title Company |
|---|---|---|---|
| Martadarma Prabenzo | $1,400,000 | -- | |
| Siegmund Mark | $1,290,550 | -- | |
| Cotler Samuel A | $717,000 | -- |
Source: Public Records
Mortgage History
| Date | Status | Borrower | Loan Amount |
|---|---|---|---|
| Open | Martadarma Prabenzo | $1,120,000 | |
| Previous Owner | Siegmund Mark | $1,032,440 | |
| Previous Owner | Cotler Samuel A | $218,000 |
Source: Public Records
Tax History Compared to Growth
Tax History
| Year | Tax Paid | Tax Assessment Tax Assessment Total Assessment is a certain percentage of the fair market value that is determined by local assessors to be the total taxable value of land and additions on the property. | Land | Improvement |
|---|---|---|---|---|
| 2025 | $506 | $87,924 | $9,120 | $78,804 |
| 2024 | $506 | $99,451 | $9,120 | $90,331 |
| 2023 | $496 | $88,901 | $9,120 | $79,781 |
| 2022 | $485 | $80,279 | $9,120 | $71,159 |
| 2021 | $366 | $59,072 | $9,120 | $49,952 |
| 2020 | $119 | $68,912 | $9,120 | $59,792 |
| 2019 | $510 | $65,786 | $9,120 | $56,666 |
| 2016 | $522 | $57,420 | $9,120 | $48,300 |
| 2015 | $408 | $48,558 | $9,120 | $39,438 |
| 2014 | $408 | $45,983 | $9,120 | $36,863 |
Source: Public Records
Map
Nearby Homes
- 46 S 2nd St Unit 4F
- 79 S 2nd St Unit TH
- 79 S 2nd St Unit 2
- 79 S 2nd St Unit TH
- 79 S 2nd St Unit 2
- 57 S 4th St Unit TH
- 57 S 4th St
- 3 Wythe Ln
- 51 S 1st St Unit 2B
- 51 S 1st St Unit 2A
- 51 S 1st St Unit 3
- 8 S 4th St Unit 40-A
- 8 S 4th St Unit 16-A
- 8 S 4th St Unit 18-C
- 8 S 4th St Unit 40-D
- 8 S 4th St Unit 38-D
- 8 S 4th St Unit 37-D
- 8 S 4th St Unit 31-E
- 8 S 4th St Unit 31-D
- 8 S 4th St Unit 38-A
- 46 S 2nd St
- 46 S 2 Nd St Unit 4 F
- 46 S 2 Nd St Unit 1 E
- 46 S 2 Nd St Unit 2 D
- 46 S 2 Nd St Unit 2 DP
- 46 S 2 Nd St Unit 3 A
- 46 S 2 Nd St Unit 4-E
- 46 S 2 Nd St Unit 3 E
- 46 S 2 Nd St Unit 3 B
- 46 S 2 Nd St Unit 2 C
- 46 S 2 Nd St Unit 4-A
- 46 S 2 Nd St Unit 2 E
- 46 S 2 Nd St Unit 2-F
- 46 S 2 Nd St Unit 3 D
- 46 S 2 Nd St Unit 4-D
- 46 S 2 Nd St Unit 1 B
- 46 S 2 Nd St Unit 1 C
- 46 S 2 Nd St Unit 2 B
- 46 S 2nd St Unit P4
- 46 S 2nd St