46 Sandy Point Ct NE Rochester, MN 55906
Estimated Value: $285,000 - $520,000
2
Beds
2
Baths
864
Sq Ft
$441/Sq Ft
Est. Value
About This Home
This home is located at 46 Sandy Point Ct NE, Rochester, MN 55906 and is currently estimated at $381,377, approximately $441 per square foot. 46 Sandy Point Ct NE is a home located in Olmsted County with nearby schools including Gage Elementary School and Century Senior High School.
Ownership History
Date
Name
Owned For
Owner Type
Purchase Details
Closed on
Dec 30, 2019
Sold by
Purvis James A and Purvis Heidi A
Bought by
Zaske Scott and Zaske Leanne M
Current Estimated Value
Home Financials for this Owner
Home Financials are based on the most recent Mortgage that was taken out on this home.
Original Mortgage
$200,000
Outstanding Balance
$176,708
Interest Rate
3.6%
Mortgage Type
New Conventional
Estimated Equity
$204,669
Purchase Details
Closed on
Oct 14, 2019
Sold by
Mcfarlane Adam Beau
Bought by
Purvis James
Create a Home Valuation Report for This Property
The Home Valuation Report is an in-depth analysis detailing your home's value as well as a comparison with similar homes in the area
Home Values in the Area
Average Home Value in this Area
Purchase History
| Date | Buyer | Sale Price | Title Company |
|---|---|---|---|
| Zaske Scott | $250,000 | None Available | |
| Purvis James | -- | None Available |
Source: Public Records
Mortgage History
| Date | Status | Borrower | Loan Amount |
|---|---|---|---|
| Open | Zaske Scott | $200,000 |
Source: Public Records
Tax History Compared to Growth
Tax History
| Year | Tax Paid | Tax Assessment Tax Assessment Total Assessment is a certain percentage of the fair market value that is determined by local assessors to be the total taxable value of land and additions on the property. | Land | Improvement |
|---|---|---|---|---|
| 2024 | $3,234 | $310,600 | $172,500 | $138,100 |
| 2023 | $2,858 | $308,100 | $172,500 | $135,600 |
| 2022 | $2,622 | $289,800 | $172,500 | $117,300 |
| 2021 | $2,458 | $244,100 | $130,000 | $114,100 |
| 2020 | $2,384 | $225,900 | $120,000 | $105,900 |
| 2019 | $2,200 | $226,600 | $100,000 | $126,600 |
| 2018 | $2,093 | $215,100 | $100,000 | $115,100 |
| 2017 | $2,028 | $210,500 | $100,000 | $110,500 |
| 2016 | $2,016 | $175,900 | $76,500 | $99,400 |
| 2015 | $1,816 | $168,700 | $75,900 | $92,800 |
| 2014 | $1,728 | $167,600 | $75,800 | $91,800 |
| 2012 | -- | $163,000 | $75,422 | $87,578 |
Source: Public Records
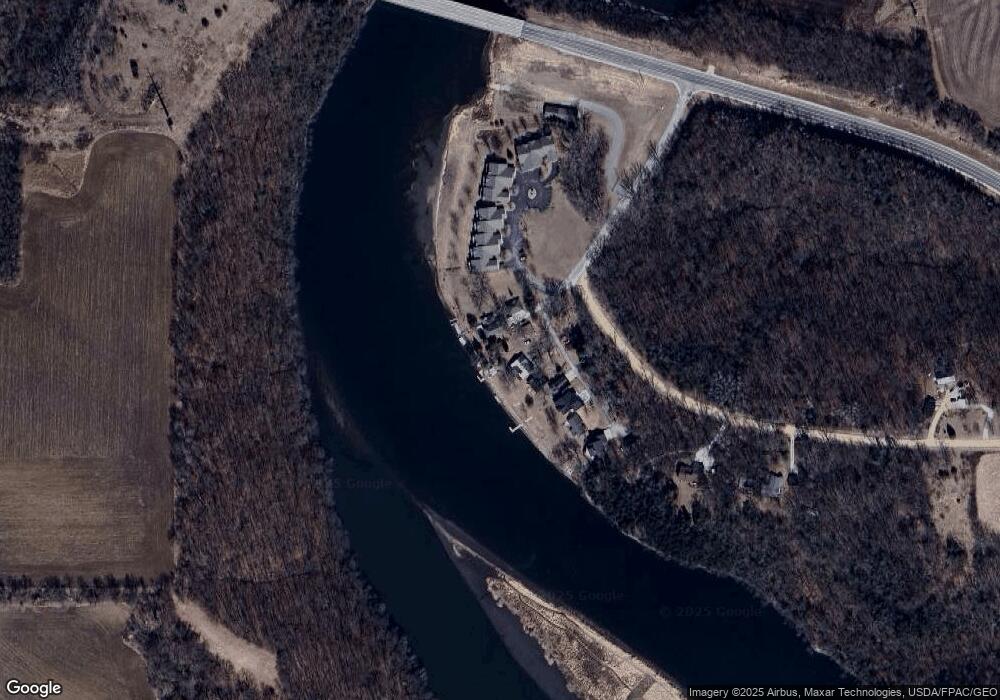
Map
Nearby Homes
- 11731 Sandy Point Ln NE
- 271 Sandy Point Ct NE
- 11355 Cedar Beach Dr NW
- XXXX Cedar Beach Dr NW
- TBD Sandy Point Ct NE
- 0 Tbd White Bridge Rd NE Unit LotWP001
- 170 Fisherman Dr NW
- 771 Zumbro Oaks Ln NW
- xxxxB Kings Park Rd NW
- xxxxC Kings Park Rd NW
- TBD Tennis Ln NW
- xxxx (Parcel 3) White Bridge Rd NE
- xxxx (Parcel 2) White Bridge Rd NE
- xxx White Bridge Rd NE
- 10482 11th Ave NE
- TBD Sunset Bay Rd
- 2700 115th St NW
- 3195 115th St NW
- 56381 400th Ave
- 9238 Miller Place NW
- 40 Sandy Point Ct NE
- 54 Sandy Point Ct NE
- 60 Sandy Point Ct NE
- 68 Sandy Point Ct NE
- 11701 Sandy Point Ln NE
- 11707 Sandy Point Ln NE
- 72 Sandy Point Ct NE
- 11713 Sandy Point Ln NE
- 11719 Sandy Point Ln NE
- 11725 Sandy Point Ln NE
- 80 Sandy Point Ct NE
- 11737 Sandy Point Ln NE
- 11743 Sandy Point Ln NE
- 11749 Sandy Point Ln NE
- 11755 Sandy Point Ln NE
- 11761 Sandy Point Ln NE
- 100 Sandy Point Ct NE
- 156 Sandy Point Ct NE
- 11396 Cedar Beach Dr NW
- 11378 Cedar Beach Dr NW