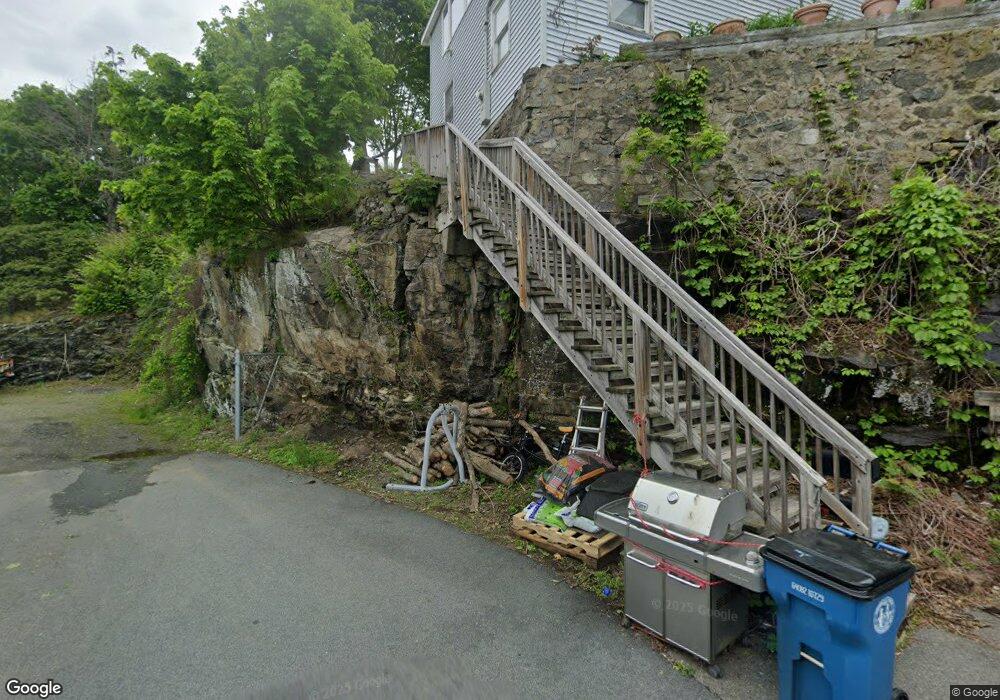
46 Spinney Path Nahant, MA 01908
Estimated Value: $608,486 - $653,000
1
Bed
2
Baths
1,006
Sq Ft
$623/Sq Ft
Est. Value
About This Home
This home is located at 46 Spinney Path, Nahant, MA 01908 and is currently estimated at $627,122, approximately $623 per square foot. 46 Spinney Path is a home located in Essex County with nearby schools including Johnson Elementary School, Swampscott Middle School, and Swampscott High School.
Ownership History
Date
Name
Owned For
Owner Type
Purchase Details
Closed on
Apr 11, 2019
Sold by
Schultze Katharine L
Bought by
Grant Charles J
Current Estimated Value
Purchase Details
Closed on
Nov 2, 2009
Sold by
Sales Options Llc
Bought by
Schultze Katharine L
Home Financials for this Owner
Home Financials are based on the most recent Mortgage that was taken out on this home.
Original Mortgage
$26,800
Interest Rate
5.06%
Mortgage Type
Purchase Money Mortgage
Purchase Details
Closed on
Sep 3, 2004
Sold by
Stanley Frederick H and Stanley Maria
Bought by
Bates Robert
Purchase Details
Closed on
Nov 16, 1992
Sold by
Garden Management Co
Bought by
Donohue Brian C
Purchase Details
Closed on
Jan 10, 1992
Sold by
Bergeron Andrew
Bought by
Garden Management
Purchase Details
Closed on
Dec 2, 1988
Sold by
46 Nahant Tr
Bought by
Bergeron Andrew D
Create a Home Valuation Report for This Property
The Home Valuation Report is an in-depth analysis detailing your home's value as well as a comparison with similar homes in the area
Home Values in the Area
Average Home Value in this Area
Purchase History
| Date | Buyer | Sale Price | Title Company |
|---|---|---|---|
| Grant Charles J | -- | -- | |
| Grant Charles J | -- | -- | |
| Grant Charles J | -- | -- | |
| Schultze Katharine L | $268,000 | -- | |
| Sales Options Llc | $214,000 | -- | |
| Schultze Katharine L | $268,000 | -- | |
| Bates Robert | $364,000 | -- | |
| Bates Robert | $364,000 | -- | |
| Donohue Brian C | $110,000 | -- | |
| Donohue Brian C | $110,000 | -- | |
| Garden Management | $146,000 | -- | |
| Garden Management | $146,000 | -- | |
| Bergeron Andrew D | $285,000 | -- |
Source: Public Records
Mortgage History
| Date | Status | Borrower | Loan Amount |
|---|---|---|---|
| Previous Owner | Bergeron Andrew D | $205,000 | |
| Previous Owner | Bergeron Andrew D | $26,800 |
Source: Public Records
Tax History
| Year | Tax Paid | Tax Assessment Tax Assessment Total Assessment is a certain percentage of the fair market value that is determined by local assessors to be the total taxable value of land and additions on the property. | Land | Improvement |
|---|---|---|---|---|
| 2025 | $4,811 | $525,800 | $299,400 | $226,400 |
| 2024 | $4,429 | $488,300 | $261,900 | $226,400 |
| 2023 | $4,210 | $463,200 | $247,000 | $216,200 |
| 2022 | $4,248 | $433,900 | $239,500 | $194,400 |
| 2021 | $4,277 | $406,900 | $224,500 | $182,400 |
| 2020 | $4,014 | $365,900 | $209,600 | $156,300 |
| 2019 | $3,650 | $334,600 | $194,600 | $140,000 |
| 2018 | $3,165 | $308,800 | $172,100 | $136,700 |
| 2017 | $3,233 | $308,800 | $172,100 | $136,700 |
| 2016 | $2,663 | $253,100 | $127,200 | $125,900 |
| 2015 | $2,695 | $246,800 | $120,900 | $125,900 |
| 2014 | $2,722 | $246,800 | $120,900 | $125,900 |
Source: Public Records
Map
Nearby Homes
- 1 Goddard Dr
- 183 Bass Point Rd
- 30 Sherman Ave
- 162 Willow Rd Unit 11
- 66 Ocean St
- 51 Cliff St
- 9 Little Nahant Rd
- 1 Carey Cir Unit 409
- 191 N Shore Rd
- 11 Archer Ave
- 123 Mills Ave
- 31 Mills Ave
- 510 Revere Beach Blvd Unit 1205
- 510 Revere Beach Blvd Unit 905
- 505 Revere Beach Blvd Unit 303
- 474 Revere Beach Blvd Unit 501
- 474 Revere Beach Blvd Unit 903
- 474 Revere Beach Blvd Unit 302
- 474 Revere Beach Blvd Unit 403
- 350 Revere Beach Blvd Unit P2-13I
- 48 Spinney Path Unit 2
- 48 Spinney Path Unit 1
- 39 Breezy Hill Terrace
- 35 Breezy Hill Terrace
- 45 Breezy Hill Terrace
- 56 Spinney Path
- 27 Breezy Hill Terrace
- 49 Breezy Hill Terrace
- 24 Irving Way
- 61 Spinney Path
- 52 Irving Way
- 46 Breezy Hill Terrace
- 38 Irving Way Unit 1
- 38 Irving Way
- 38 Irving Way
- 62 Spinney Path
- 57 Breezy Hill Terrace
- 26 Breezy Hill Terrace
- 54 Irving Way
- 17 Spinney Path
Your Personal Tour Guide
Ask me questions while you tour the home.