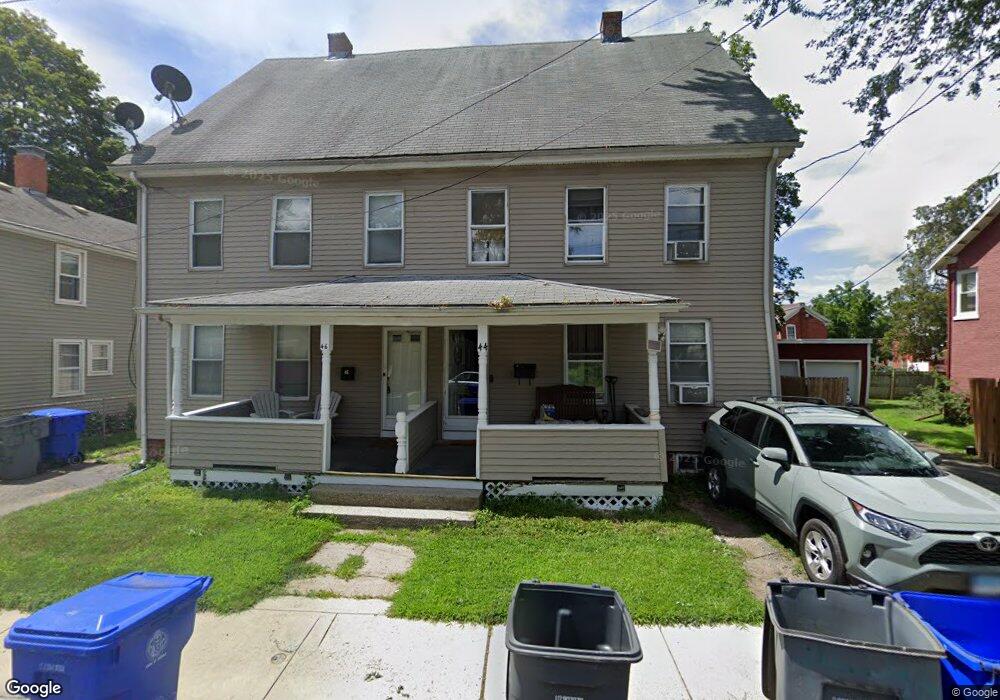
46 Spring St Enfield, CT 06082
Estimated Value: $322,294 - $359,000
8
Beds
2
Baths
3,456
Sq Ft
$98/Sq Ft
Est. Value
About This Home
This home is located at 46 Spring St, Enfield, CT 06082 and is currently estimated at $339,574, approximately $98 per square foot. 46 Spring St is a home located in Hartford County with nearby schools including Eli Whitney Elementary School, Hazardville Memorial Elementary School, and Enfield High School.
Ownership History
Date
Name
Owned For
Owner Type
Purchase Details
Closed on
Jun 9, 2025
Sold by
Mccray Sharon R and Mccray Stephen
Bought by
Watts Brianna
Current Estimated Value
Home Financials for this Owner
Home Financials are based on the most recent Mortgage that was taken out on this home.
Original Mortgage
$317,968
Outstanding Balance
$315,871
Interest Rate
6.37%
Mortgage Type
FHA
Estimated Equity
$23,703
Create a Home Valuation Report for This Property
The Home Valuation Report is an in-depth analysis detailing your home's value as well as a comparison with similar homes in the area
Home Values in the Area
Average Home Value in this Area
Purchase History
| Date | Buyer | Sale Price | Title Company |
|---|---|---|---|
| Watts Brianna | $329,900 | None Available | |
| Watts Brianna | $329,900 | None Available |
Source: Public Records
Mortgage History
| Date | Status | Borrower | Loan Amount |
|---|---|---|---|
| Open | Watts Brianna | $317,968 | |
| Closed | Watts Brianna | $317,968 |
Source: Public Records
Tax History
| Year | Tax Paid | Tax Assessment Tax Assessment Total Assessment is a certain percentage of the fair market value that is determined by local assessors to be the total taxable value of land and additions on the property. | Land | Improvement |
|---|---|---|---|---|
| 2025 | $5,964 | $159,900 | $23,100 | $136,800 |
| 2024 | $5,391 | $148,500 | $23,100 | $125,400 |
| 2023 | $5,391 | $148,500 | $23,100 | $125,400 |
| 2022 | $4,994 | $148,500 | $23,100 | $125,400 |
| 2021 | $4,919 | $119,710 | $27,820 | $91,890 |
| 2020 | $4,871 | $119,710 | $27,820 | $91,890 |
| 2019 | $4,911 | $119,710 | $27,820 | $91,890 |
| 2018 | $4,804 | $119,710 | $27,820 | $91,890 |
| 2017 | $4,761 | $119,710 | $27,820 | $91,890 |
| 2016 | $4,929 | $125,740 | $27,820 | $97,920 |
| 2015 | $4,807 | $125,740 | $27,820 | $97,920 |
| 2014 | $4,574 | $125,740 | $27,820 | $97,920 |
Source: Public Records
Map
Nearby Homes
- 69 Prospect St
- 20 Walnut St
- 80 S River St
- 57 Asnuntuck St
- 8 Frew Terrace
- 30 Church St
- 26 Church St
- 60 Lincoln St
- 180 Dusky Ln
- 83 Landing Cir Unit 83
- 78 Landing Cir Unit 78
- 3 Martin St
- 15 Summer St
- 42 Hartford Ave
- 24 Pebblestone Cir Unit 24
- 39 Union Street Extension
- 45 Douglas St
- 155 Mountain Laurel Way
- 4 Pebblestone Cir
- 1165 Enfield St Unit 11
Your Personal Tour Guide
Ask me questions while you tour the home.