
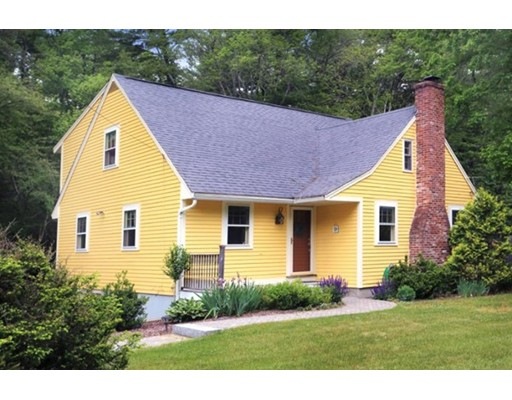

46 Tenney St Georgetown, MA 01833
3
Beds
2
Baths
1,779
Sq Ft
1.68
Acres
About This Home
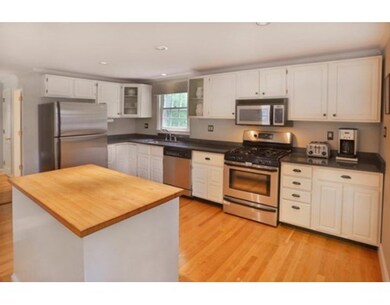
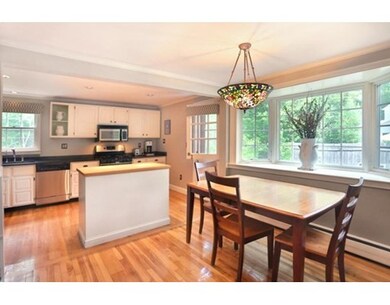
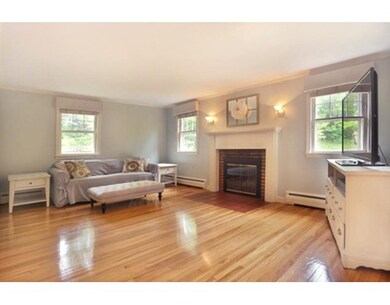
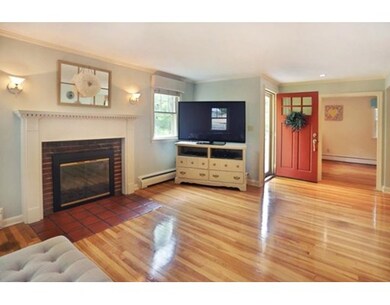
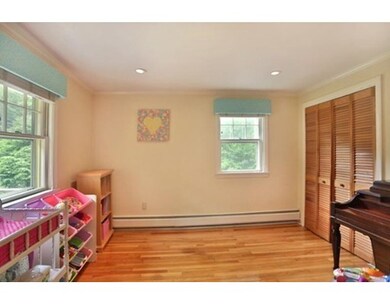
As of July 2022...Welcome to a gorgeous Cape in Georgetown, MA in MINT condition! 2 full bathrooms. 1st floor guest bedroom and den/office. 3 bedrooms on the 2nd floor including a walk in Master closet. Gleaming hardwood floors throughout !!! Granite kitchen, SS appliances and a wood burning fireplace in the living room. Lots of storage including a full walk out basement. One car garage. Set back from the road and nicely sited. Subject to the seller purchasing another home within 30 days.
Home Details
Home Type
- Single Family
Est. Annual Taxes
- $6,545
Year Built
- 1961
Utilities
- Private Sewer
Ownership History
Date
Name
Owned For
Owner Type
Purchase Details
Listed on
Jun 8, 2016
Closed on
Aug 26, 2016
Sold by
Palermo Patrick
Bought by
Ashby Mary
Seller's Agent
Lynn Pappas
Realty One Group Nest
Buyer's Agent
Gail Fennessey
Advisors Living - Merrimac
List Price
$415,000
Sold Price
$420,000
Premium/Discount to List
$5,000
1.2%
Current Estimated Value
Home Financials for this Owner
Home Financials are based on the most recent Mortgage that was taken out on this home.
Estimated Appreciation
$321,649
Avg. Annual Appreciation
6.56%
Original Mortgage
$173,992
Interest Rate
3.87%
Mortgage Type
FHA
Purchase Details
Listed on
Feb 8, 2012
Closed on
Jun 29, 2012
Sold by
Mazzaglia Cindy L and Terrasi Joseph D
Bought by
Palermo Patrick
Seller's Agent
Jay LeClerc
Realty One Group Nest
Buyer's Agent
Terri Maffeo
LAER Realty Partners
List Price
$369,777
Sold Price
$364,000
Premium/Discount to List
-$5,777
-1.56%
Home Financials for this Owner
Home Financials are based on the most recent Mortgage that was taken out on this home.
Avg. Annual Appreciation
3.50%
Original Mortgage
$345,800
Interest Rate
3.78%
Mortgage Type
New Conventional
Purchase Details
Closed on
Nov 13, 2009
Sold by
Zavaski Scott J and Zavaski Kristen L
Bought by
Mazzaglia Cindy L
Home Financials for this Owner
Home Financials are based on the most recent Mortgage that was taken out on this home.
Original Mortgage
$352,355
Interest Rate
4.98%
Mortgage Type
Purchase Money Mortgage
Purchase Details
Closed on
Jan 24, 2007
Sold by
Atkins Mark R and Kapinos Theodore S
Bought by
Zavaski Scott J and Zavaski Kristen L
Purchase Details
Closed on
Jun 13, 2002
Sold by
Silverman Scott and Silverman Justyna
Bought by
Atkins Mark
Purchase Details
Closed on
Jul 29, 1996
Sold by
Woods Mark E and Woods Elsie A
Bought by
Silverman Scott E and Silverman Justyna M
Purchase Details
Closed on
Apr 28, 1989
Sold by
Greene Walda
Bought by
Woods Mark E
Similar Homes in Georgetown, MA
Create a Home Valuation Report for This Property
The Home Valuation Report is an in-depth analysis detailing your home's value as well as a comparison with similar homes in the area
Home Values in the Area
Average Home Value in this Area
Purchase History
| Date | Type | Sale Price | Title Company |
|---|---|---|---|
| Not Resolvable | $420,000 | -- | |
| Not Resolvable | $364,000 | -- | |
| Deed | $370,900 | -- | |
| Deed | $380,000 | -- | |
| Deed | $327,000 | -- | |
| Deed | $191,450 | -- | |
| Deed | $174,900 | -- |
Source: Public Records
Mortgage History
| Date | Status | Loan Amount | Loan Type |
|---|---|---|---|
| Open | $395,000 | Purchase Money Mortgage | |
| Closed | $173,992 | FHA | |
| Previous Owner | $345,800 | New Conventional | |
| Previous Owner | $352,355 | Purchase Money Mortgage |
Source: Public Records
Property History
| Date | Event | Price | Change | Sq Ft Price |
|---|---|---|---|---|
| 07/29/2022 07/29/22 | Sold | $660,000 | +12.1% | $360 / Sq Ft |
| 06/26/2022 06/26/22 | Pending | -- | -- | -- |
| 06/22/2022 06/22/22 | For Sale | $589,000 | +40.2% | $322 / Sq Ft |
| 08/26/2016 08/26/16 | Sold | $420,000 | +1.2% | $236 / Sq Ft |
| 06/14/2016 06/14/16 | Pending | -- | -- | -- |
| 06/08/2016 06/08/16 | For Sale | $415,000 | +14.0% | $233 / Sq Ft |
| 06/29/2012 06/29/12 | Sold | $364,000 | -1.0% | $232 / Sq Ft |
| 05/07/2012 05/07/12 | Pending | -- | -- | -- |
| 03/24/2012 03/24/12 | Price Changed | $367,770 | -0.5% | $235 / Sq Ft |
| 02/08/2012 02/08/12 | For Sale | $369,777 | -- | $236 / Sq Ft |
Source: MLS Property Information Network (MLS PIN)
Tax History Compared to Growth
Tax History
| Year | Tax Paid | Tax Assessment Tax Assessment Total Assessment is a certain percentage of the fair market value that is determined by local assessors to be the total taxable value of land and additions on the property. | Land | Improvement |
|---|---|---|---|---|
| 2025 | $6,545 | $591,800 | $283,400 | $308,400 |
| 2024 | $8,067 | $642,800 | $196,600 | $446,200 |
| 2023 | $6,678 | $514,500 | $196,600 | $317,900 |
| 2022 | $6,889 | $489,300 | $171,400 | $317,900 |
| 2021 | $6,283 | $395,400 | $171,400 | $224,000 |
| 2020 | $6,295 | $395,400 | $171,400 | $224,000 |
| 2019 | $6,189 | $392,200 | $168,200 | $224,000 |
| 2018 | $6,228 | $392,200 | $168,200 | $224,000 |
| 2017 | $5,605 | $345,800 | $168,200 | $177,600 |
| 2016 | $5,296 | $333,700 | $168,200 | $165,500 |
| 2015 | $5,527 | $344,800 | $168,200 | $176,600 |
| 2014 | $4,844 | $344,800 | $168,200 | $176,600 |
Source: Public Records
Agents Affiliated with this Home
-
Seller's Agent in 2022
Callie Umenhofer
Keller Williams Realty Evolution
(978) 352-3167
12 in this area
54 Total Sales
-
W
Buyer's Agent in 2022
Will Sobo
Coldwell Banker Realty - Lexington
-
Seller's Agent in 2016
Lynn Pappas
Realty One Group Nest
(978) 852-6292
1 in this area
36 Total Sales
-
Buyer's Agent in 2016
Gail Fennessey
Advisors Living - Merrimac
(978) 771-0442
9 in this area
14 Total Sales
-
Seller's Agent in 2012
Jay LeClerc
Realty One Group Nest
(978) 985-6329
3 in this area
89 Total Sales
-
Buyer's Agent in 2012
Terri Maffeo
Laer Realty
(781) 801-3455
23 Total Sales
Map
Source: MLS Property Information Network (MLS PIN)
MLS Number: 72019248
APN: GEOR-000015-000000-000000-000012-000012
Disclaimer: Certain information contained herein is derived from information provided by parties other than Homes.com. All information provided is deemed reliable, but is not guaranteed to be accurate and should be independently verified.
![]() The property listing data and information, or the Images, set forth herein were provided to MLS Property Information Network, Inc. from third party sources, including sellers, lessors and public records, and were compiled by MLS Property Information Network, Inc. The property listing data and information, and the Images, are for the personal, non-commercial use of consumers having a good faith interest in purchasing or leasing listed properties of the type displayed to them and may not be used for any purpose other than to identify prospective properties which such consumers may have a good faith interest in purchasing or leasing. MLS Property Information Network, Inc. and its subscribers disclaim any and all representations and warranties as to the accuracy of the property listing data and information, or as to the accuracy of any of the Images, set forth herein.
The property listing data and information, or the Images, set forth herein were provided to MLS Property Information Network, Inc. from third party sources, including sellers, lessors and public records, and were compiled by MLS Property Information Network, Inc. The property listing data and information, and the Images, are for the personal, non-commercial use of consumers having a good faith interest in purchasing or leasing listed properties of the type displayed to them and may not be used for any purpose other than to identify prospective properties which such consumers may have a good faith interest in purchasing or leasing. MLS Property Information Network, Inc. and its subscribers disclaim any and all representations and warranties as to the accuracy of the property listing data and information, or as to the accuracy of any of the Images, set forth herein.
Nearby Homes