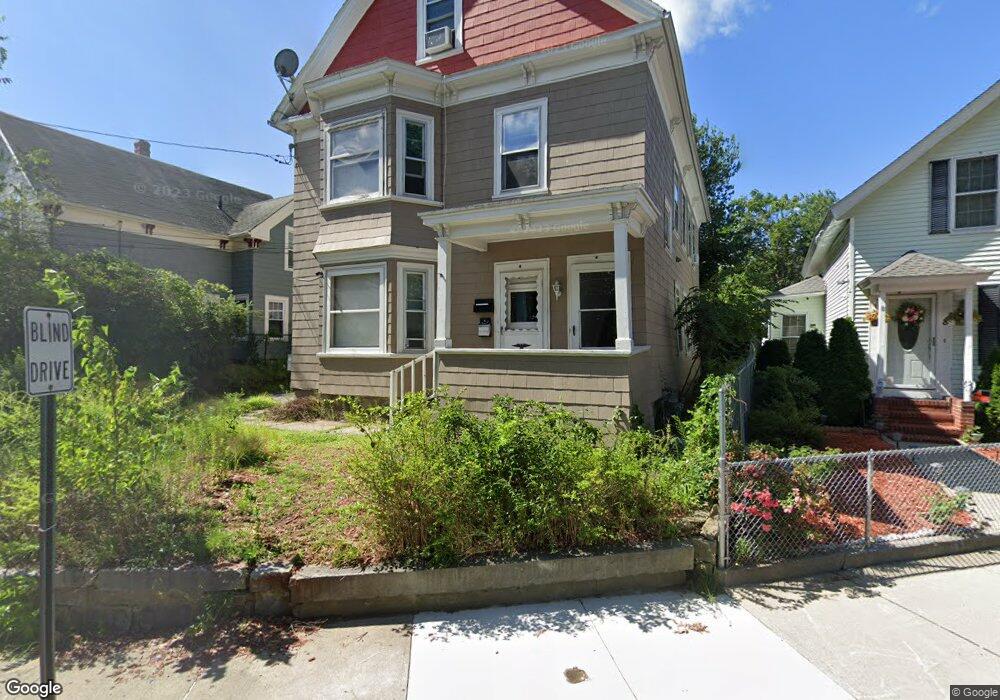
46 Union St Methuen, MA 01844
Downtown Methuen NeighborhoodEstimated Value: $627,930 - $727,000
4
Beds
2
Baths
2,282
Sq Ft
$296/Sq Ft
Est. Value
About This Home
This home is located at 46 Union St, Methuen, MA 01844 and is currently estimated at $675,233, approximately $295 per square foot. 46 Union St is a home located in Essex County with nearby schools including Marsh Grammar School, Methuen High School, and Saint Monica School.
Ownership History
Date
Name
Owned For
Owner Type
Purchase Details
Closed on
May 24, 2013
Sold by
Ahmed Faisal
Bought by
Nss 3 Sisters Rt and Ahmed
Current Estimated Value
Purchase Details
Closed on
May 30, 2012
Sold by
Dorceus Alyssa
Bought by
Ahmed Faisal
Purchase Details
Closed on
Nov 22, 2006
Sold by
Karavias Nicholas T and Karavias Nickolas T
Bought by
Dorceus Alyssa
Home Financials for this Owner
Home Financials are based on the most recent Mortgage that was taken out on this home.
Original Mortgage
$254,400
Interest Rate
6.39%
Mortgage Type
Purchase Money Mortgage
Purchase Details
Closed on
Dec 30, 2002
Sold by
Salas Belkis
Bought by
Karavias Nicholas T
Home Financials for this Owner
Home Financials are based on the most recent Mortgage that was taken out on this home.
Original Mortgage
$270,200
Interest Rate
6.02%
Mortgage Type
Purchase Money Mortgage
Purchase Details
Closed on
Sep 15, 2000
Sold by
Fox Edward J and Fox Diane W
Bought by
Salas Belkis
Create a Home Valuation Report for This Property
The Home Valuation Report is an in-depth analysis detailing your home's value as well as a comparison with similar homes in the area
Home Values in the Area
Average Home Value in this Area
Purchase History
| Date | Buyer | Sale Price | Title Company |
|---|---|---|---|
| Nss 3 Sisters Rt | -- | -- | |
| Nss 3 Sisters Rt | -- | -- | |
| Ahmed Faisal | $170,000 | -- | |
| Dorceus Alyssa | $318,000 | -- | |
| Dorceus Alyssa | $318,000 | -- | |
| Karavias Nicholas T | $284,450 | -- | |
| Karavias Nicholas T | $284,450 | -- | |
| Salas Belkis | $144,000 | -- | |
| Salas Belkis | $144,000 | -- |
Source: Public Records
Mortgage History
| Date | Status | Borrower | Loan Amount |
|---|---|---|---|
| Previous Owner | Dorceus Alyssa | $254,400 | |
| Previous Owner | Dorceus Alyssa | $63,600 | |
| Previous Owner | Salas Belkis | $270,200 |
Source: Public Records
Tax History
| Year | Tax Paid | Tax Assessment Tax Assessment Total Assessment is a certain percentage of the fair market value that is determined by local assessors to be the total taxable value of land and additions on the property. | Land | Improvement |
|---|---|---|---|---|
| 2025 | $6,015 | $568,500 | $185,600 | $382,900 |
| 2024 | $5,433 | $500,300 | $162,300 | $338,000 |
| 2023 | $5,281 | $451,400 | $142,800 | $308,600 |
| 2022 | $4,798 | $367,700 | $116,800 | $250,900 |
| 2021 | $4,595 | $348,400 | $110,300 | $238,100 |
| 2020 | $4,424 | $329,200 | $110,300 | $218,900 |
| 2019 | $4,070 | $286,800 | $103,800 | $183,000 |
| 2018 | $3,790 | $265,600 | $97,300 | $168,300 |
| 2017 | $3,648 | $249,000 | $90,900 | $158,100 |
| 2016 | $3,344 | $225,800 | $84,400 | $141,400 |
| 2015 | $3,203 | $219,400 | $84,400 | $135,000 |
Source: Public Records
Map
Nearby Homes
- 9-11 Horne St
- 24 Railroad St
- 20-22 Ashland Ave
- 23 Chase St
- 29 Center St
- 7-9 Carleton Ct
- 82 Oakside Ave
- 7 Field Ave
- 23 Bentley Cir
- 20 Ruskin Ave
- 97 Kenwood Rd
- 434-438 Hampshire St
- 36 Manchester St
- 27 Willow St Unit A
- 179-181 West St
- 29-31 Washington St
- 37 Maplewood Ave
- 10 Holly St
- 129-131 Lexington St
- 324-326 Broadway
- 4-6 Union St
- 74-74 1/2 Union St
- 8 Union St
- 2 Union St
- 2 Edmond St
- 10 Union St Unit 12
- 7 Oakland Ave
- 11 Oakland Ave
- 19 Union St
- 267(Lot 9) Oakland Ave Extension
- 13 Oakland Ave
- 21 Union St
- 178 Broadway
- 178 Broadway Unit 2
- 6 Edmond St
- 3 Union St
- 4 Edmond St
- 5 Union St Unit 2
- 180 Broadway
- 14-16 Union St
Your Personal Tour Guide
Ask me questions while you tour the home.