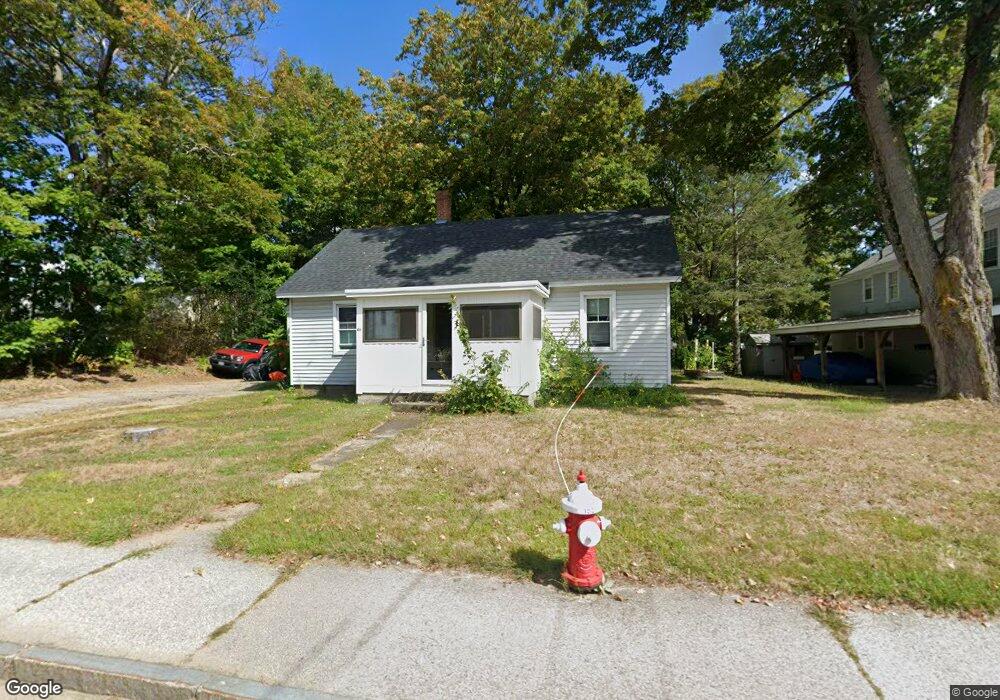
46 Union St Milford, NH 03055
Estimated Value: $370,677 - $393,000
3
Beds
1
Bath
1,188
Sq Ft
$322/Sq Ft
Est. Value
About This Home
This home is located at 46 Union St, Milford, NH 03055 and is currently estimated at $382,919, approximately $322 per square foot. 46 Union St is a home located in Hillsborough County with nearby schools including Jacques Memorial Elementary School, Heron Pond Elementary School, and Milford Middle School.
Ownership History
Date
Name
Owned For
Owner Type
Purchase Details
Closed on
Mar 29, 2011
Sold by
Fnma
Bought by
Wood Steven J
Current Estimated Value
Home Financials for this Owner
Home Financials are based on the most recent Mortgage that was taken out on this home.
Original Mortgage
$132,746
Interest Rate
5.07%
Mortgage Type
Purchase Money Mortgage
Purchase Details
Closed on
Sep 30, 2010
Sold by
Lacroix Scott J and Fnma
Bought by
Federal National Mortgage Association
Create a Home Valuation Report for This Property
The Home Valuation Report is an in-depth analysis detailing your home's value as well as a comparison with similar homes in the area
Home Values in the Area
Average Home Value in this Area
Purchase History
| Date | Buyer | Sale Price | Title Company |
|---|---|---|---|
| Wood Steven J | $128,100 | -- | |
| Federal National Mortgage Association | $167,800 | -- |
Source: Public Records
Mortgage History
| Date | Status | Borrower | Loan Amount |
|---|---|---|---|
| Open | Federal National Mortgage Association | $125,240 | |
| Closed | Federal National Mortgage Association | $132,746 | |
| Previous Owner | Federal National Mortgage Association | $155,400 | |
| Previous Owner | Federal National Mortgage Association | $136,000 |
Source: Public Records
Tax History Compared to Growth
Tax History
| Year | Tax Paid | Tax Assessment Tax Assessment Total Assessment is a certain percentage of the fair market value that is determined by local assessors to be the total taxable value of land and additions on the property. | Land | Improvement |
|---|---|---|---|---|
| 2024 | $5,233 | $221,100 | $78,500 | $142,600 |
| 2023 | $4,902 | $221,100 | $78,500 | $142,600 |
| 2022 | $4,597 | $221,100 | $78,500 | $142,600 |
| 2021 | $4,455 | $221,100 | $78,500 | $142,600 |
| 2020 | $4,764 | $187,800 | $56,800 | $131,000 |
| 2019 | $4,877 | $187,800 | $56,800 | $131,000 |
| 2018 | $4,513 | $154,400 | $55,300 | $99,100 |
| 2017 | $4,538 | $154,400 | $55,300 | $99,100 |
| 2016 | $4,471 | $154,400 | $55,300 | $99,100 |
| 2015 | $4,298 | $150,500 | $55,300 | $95,200 |
| 2014 | $4,109 | $150,500 | $55,300 | $95,200 |
| 2013 | $4,062 | $150,600 | $55,300 | $95,300 |
Source: Public Records
Map
Nearby Homes
- 24 Spaulding St
- 44 Osgood Rd
- 377 Nashua St
- 61 W Meadow Ct
- 40 North St
- 0 Briar Cliff Dr
- 0 Claude Rd
- 7 Fox Run Rd
- 57 Patch Hill Ln
- 145 Westchester Dr
- 229 Mont Vernon Rd
- 26 Melendy Rd Unit 97
- 26 Melendy Rd Unit 42
- 32 Larch Rd
- 43 Boxwood Cir
- 344 Elm St Unit 14
- 344 Elm St Unit 16
- 2 Benning St
- 64 Lyndeborough Rd
- 7 Miles Rd