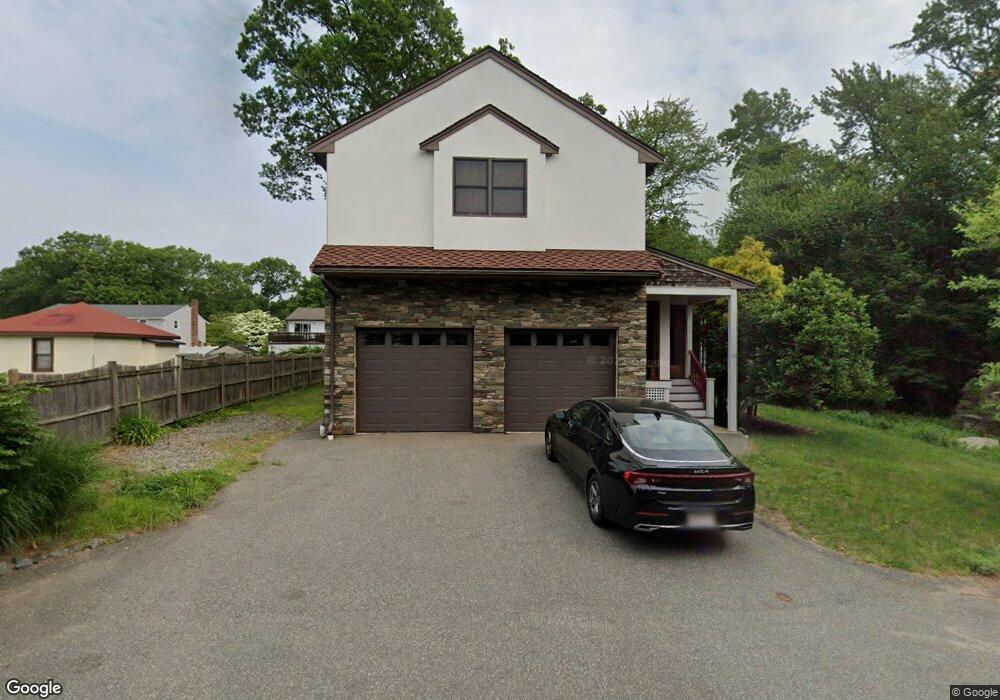
46 Vega Ave Brockton, MA 02302
Campello NeighborhoodEstimated Value: $710,030 - $786,000
3
Beds
3
Baths
2,400
Sq Ft
$306/Sq Ft
Est. Value
About This Home
This home is located at 46 Vega Ave, Brockton, MA 02302 and is currently estimated at $734,508, approximately $306 per square foot. 46 Vega Ave is a home located in Plymouth County with nearby schools including Davis K-8 School, John F. Kennedy Elementary School, and South Middle School.
Ownership History
Date
Name
Owned For
Owner Type
Purchase Details
Closed on
May 21, 2013
Sold by
Ngwenya Roberta Y and Ngwenya Edgar A
Bought by
Roberta Y Ret and Ngwenya Roberta Y
Current Estimated Value
Purchase Details
Closed on
Jun 17, 2008
Sold by
Trojano Michael F
Bought by
Ngwenya Edgar A and Ngwenya Roberta Y
Home Financials for this Owner
Home Financials are based on the most recent Mortgage that was taken out on this home.
Original Mortgage
$310,000
Interest Rate
6.13%
Mortgage Type
Purchase Money Mortgage
Create a Home Valuation Report for This Property
The Home Valuation Report is an in-depth analysis detailing your home's value as well as a comparison with similar homes in the area
Home Values in the Area
Average Home Value in this Area
Purchase History
| Date | Buyer | Sale Price | Title Company |
|---|---|---|---|
| Roberta Y Ret | -- | -- | |
| Ngwenya Edgar A | $387,500 | -- |
Source: Public Records
Mortgage History
| Date | Status | Borrower | Loan Amount |
|---|---|---|---|
| Previous Owner | Ngwenya Edgar A | $310,000 |
Source: Public Records
Tax History Compared to Growth
Tax History
| Year | Tax Paid | Tax Assessment Tax Assessment Total Assessment is a certain percentage of the fair market value that is determined by local assessors to be the total taxable value of land and additions on the property. | Land | Improvement |
|---|---|---|---|---|
| 2025 | $7,611 | $628,500 | $236,100 | $392,400 |
| 2024 | $7,070 | $588,200 | $236,100 | $352,100 |
| 2023 | $7,513 | $578,800 | $199,700 | $379,100 |
| 2022 | $7,107 | $508,700 | $181,600 | $327,100 |
| 2021 | $6,293 | $434,000 | $135,100 | $298,900 |
| 2020 | $6,374 | $420,700 | $118,000 | $302,700 |
| 2019 | $6,580 | $423,400 | $110,300 | $313,100 |
| 2018 | $6,101 | $379,900 | $110,300 | $269,600 |
| 2017 | $5,719 | $355,200 | $110,300 | $244,900 |
| 2016 | $6,119 | $352,500 | $108,000 | $244,500 |
| 2015 | $6,135 | $338,000 | $108,000 | $230,000 |
| 2014 | $5,916 | $326,300 | $108,000 | $218,300 |
Source: Public Records
Map
Nearby Homes