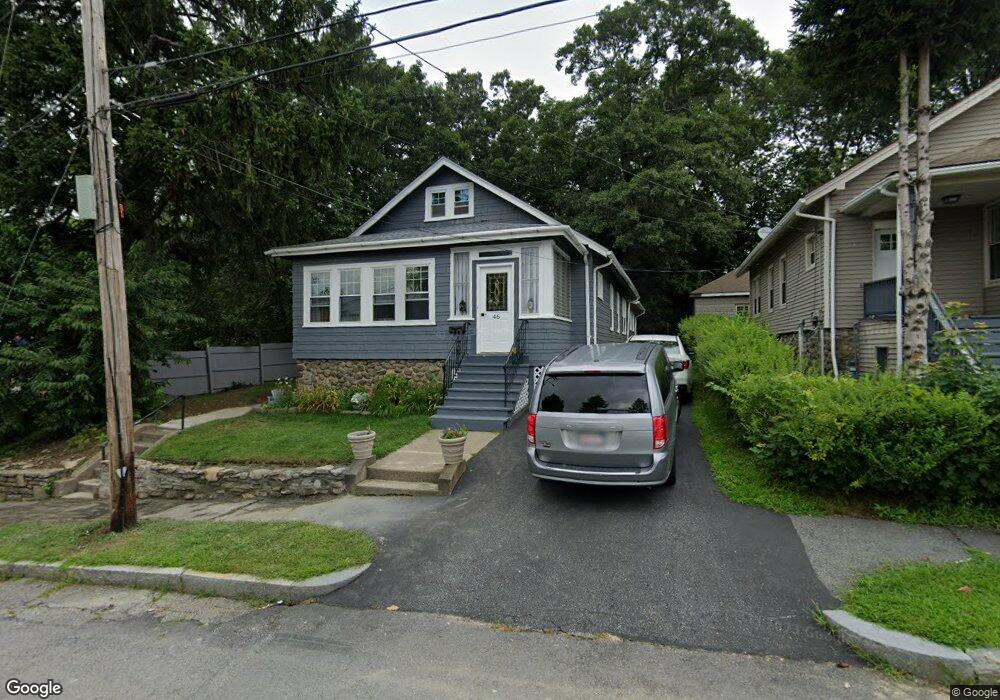
46 Volkmar Rd Worcester, MA 01606
Greendale NeighborhoodEstimated Value: $386,000 - $421,000
3
Beds
1
Bath
1,501
Sq Ft
$267/Sq Ft
Est. Value
About This Home
This home is located at 46 Volkmar Rd, Worcester, MA 01606 and is currently estimated at $401,065, approximately $267 per square foot. 46 Volkmar Rd is a home located in Worcester County with nearby schools including Belmont Street Community School, Jacob Hiatt Magnet School, and Chandler Magnet.
Ownership History
Date
Name
Owned For
Owner Type
Purchase Details
Closed on
Jun 18, 2008
Sold by
Bowlin Darlene and Bowlin Robert
Bought by
Bowlin Robert
Current Estimated Value
Purchase Details
Closed on
Apr 18, 2003
Sold by
Atchue Kenneth D and Atchue Clara A
Bought by
Bowlin Robert E and Bowlin Darlene
Home Financials for this Owner
Home Financials are based on the most recent Mortgage that was taken out on this home.
Original Mortgage
$153,000
Interest Rate
5.75%
Mortgage Type
Purchase Money Mortgage
Create a Home Valuation Report for This Property
The Home Valuation Report is an in-depth analysis detailing your home's value as well as a comparison with similar homes in the area
Home Values in the Area
Average Home Value in this Area
Purchase History
| Date | Buyer | Sale Price | Title Company |
|---|---|---|---|
| Bowlin Robert | -- | -- | |
| Bowlin Robert E | $170,000 | -- |
Source: Public Records
Mortgage History
| Date | Status | Borrower | Loan Amount |
|---|---|---|---|
| Previous Owner | Bowlin Robert E | $153,000 |
Source: Public Records
Tax History
| Year | Tax Paid | Tax Assessment Tax Assessment Total Assessment is a certain percentage of the fair market value that is determined by local assessors to be the total taxable value of land and additions on the property. | Land | Improvement |
|---|---|---|---|---|
| 2025 | $4,264 | $323,300 | $107,900 | $215,400 |
| 2024 | $4,099 | $298,100 | $107,900 | $190,200 |
| 2023 | $3,923 | $273,600 | $93,800 | $179,800 |
| 2022 | $3,599 | $236,600 | $75,100 | $161,500 |
| 2021 | $3,489 | $214,300 | $60,100 | $154,200 |
| 2020 | $3,330 | $195,900 | $60,100 | $135,800 |
| 2019 | $3,195 | $177,500 | $54,000 | $123,500 |
| 2018 | $3,188 | $168,600 | $54,000 | $114,600 |
| 2017 | $3,058 | $159,100 | $54,000 | $105,100 |
| 2016 | $3,030 | $147,000 | $40,900 | $106,100 |
| 2015 | $2,950 | $147,000 | $40,900 | $106,100 |
| 2014 | $2,872 | $147,000 | $40,900 | $106,100 |
Source: Public Records
Map
Nearby Homes
- 93 Blue Bell Rd
- 4 Winston Rd
- 30 Danielles Way
- 18 Danielles Way
- 39 Mountainshire Dr
- 36 Sunrise Ave
- 31 Danielles Way
- 10 Beale St
- 22 Danielles Way
- 26 Danielles Way
- 12 Beale St
- 66 Eunice Ave
- 55 Apthorp St
- 1110 W Boylston St Unit A
- 331 Burncoat St
- 69 Santoro Rd
- 33 Santoro Rd
- 63 Cobblestone Ln Unit 63
- 31 Enaya Cir Unit 31
- 71 Hillside Village Dr
Your Personal Tour Guide
Ask me questions while you tour the home.