46 West Walk Unit 46 West Haven, CT 06516
West Haven Center NeighborhoodEstimated Value: $304,397 - $330,000
2
Beds
2
Baths
1,174
Sq Ft
$268/Sq Ft
Est. Value
About This Home
This home is located at 46 West Walk Unit 46, West Haven, CT 06516 and is currently estimated at $314,599, approximately $267 per square foot. 46 West Walk Unit 46 is a home located in New Haven County with nearby schools including Carrigan 5/6 Intermediate School, Harry M. Bailey Middle School, and West Haven High School.
Ownership History
Date
Name
Owned For
Owner Type
Purchase Details
Closed on
Dec 29, 2021
Sold by
Gosselin Karen L and Corrado Megan
Bought by
Gosselin Karen
Current Estimated Value
Home Financials for this Owner
Home Financials are based on the most recent Mortgage that was taken out on this home.
Original Mortgage
$169,900
Outstanding Balance
$146,123
Interest Rate
3.12%
Mortgage Type
Stand Alone Refi Refinance Of Original Loan
Estimated Equity
$168,476
Purchase Details
Closed on
Jun 21, 2005
Sold by
Villoverde Murray and Villoverde Lorraine
Bought by
Gosselin Karen L and Okeefe Megan E
Home Financials for this Owner
Home Financials are based on the most recent Mortgage that was taken out on this home.
Original Mortgage
$234,502
Interest Rate
5.78%
Purchase Details
Closed on
Mar 21, 2005
Sold by
Sobey Joan M Est
Bought by
Villoverde Murray and Villoverde Lorraine
Create a Home Valuation Report for This Property
The Home Valuation Report is an in-depth analysis detailing your home's value as well as a comparison with similar homes in the area
Home Values in the Area
Average Home Value in this Area
Purchase History
| Date | Buyer | Sale Price | Title Company |
|---|---|---|---|
| Gosselin Karen | -- | None Available | |
| Gosselin Karen | -- | None Available | |
| Gosselin Karen L | $239,000 | -- | |
| Gosselin Karen L | $239,000 | -- | |
| Villoverde Murray | $185,000 | -- | |
| Villoverde Murray | $185,000 | -- |
Source: Public Records
Mortgage History
| Date | Status | Borrower | Loan Amount |
|---|---|---|---|
| Open | Gosselin Karen | $169,900 | |
| Previous Owner | Villoverde Murray | $230,252 | |
| Previous Owner | Villoverde Murray | $234,502 |
Source: Public Records
Tax History Compared to Growth
Tax History
| Year | Tax Paid | Tax Assessment Tax Assessment Total Assessment is a certain percentage of the fair market value that is determined by local assessors to be the total taxable value of land and additions on the property. | Land | Improvement |
|---|---|---|---|---|
| 2025 | $6,492 | $188,020 | $0 | $188,020 |
| 2024 | $4,510 | $92,960 | $0 | $92,960 |
| 2023 | $4,324 | $92,960 | $0 | $92,960 |
| 2022 | $4,239 | $92,960 | $0 | $92,960 |
| 2021 | $4,239 | $92,960 | $0 | $92,960 |
| 2020 | $5,066 | $100,380 | $0 | $100,380 |
| 2019 | $4,885 | $100,380 | $0 | $100,380 |
| 2018 | $4,843 | $100,380 | $0 | $100,380 |
| 2017 | $4,583 | $100,380 | $0 | $100,380 |
| 2016 | $4,573 | $100,380 | $0 | $100,380 |
| 2015 | $5,389 | $133,560 | $0 | $133,560 |
| 2014 | $5,356 | $133,560 | $0 | $133,560 |
Source: Public Records
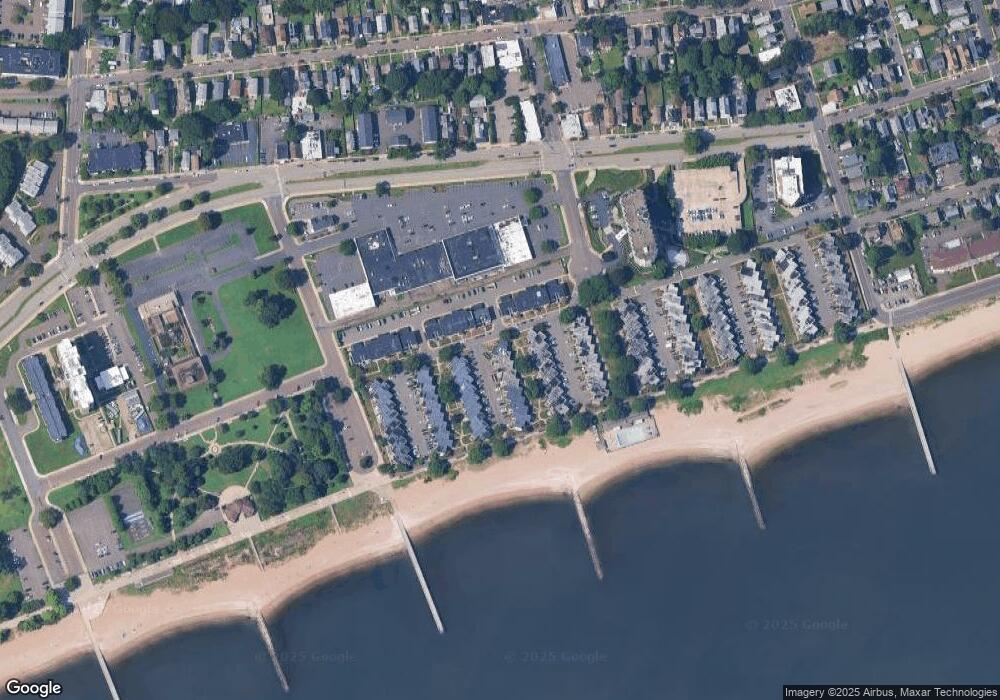
Map
Nearby Homes
- 65 West Walk
- 31 West Walk Unit 31
- 140 Captain Thomas Blvd Unit 302
- 204 West Walk Unit 204
- 189 Park St
- 314 Park St
- 94 Thomas St
- 1 Peck Ave Unit 11
- 248 William St
- 202 Campbell Ave
- 12 East Ave
- 34 Thomas St
- 88 William St
- 159 Leete St
- 72 Atwater St
- 225 Beach St Unit 2H
- 481 Savin Ave
- 90 Blohm St
- 341 Peck Ave
- 232 Court St
- 46 West Walk
- 37 West Walk
- 222 West Walk
- 222 West Walk Unit 222
- 220 West Walk
- 47 West Walk
- 38 West Walk
- 47 West Walk Unit 47
- 240 West Walk
- 240 West Walk Unit 240
- 244 West Walk
- 48 West Walk
- 39 West Walk
- 48 West Walk Unit 48
- 246 West Walk
- 250 West Walk
- 252 West Walk
- 49 West Walk
- 40 West Walk
- 254 West Walk