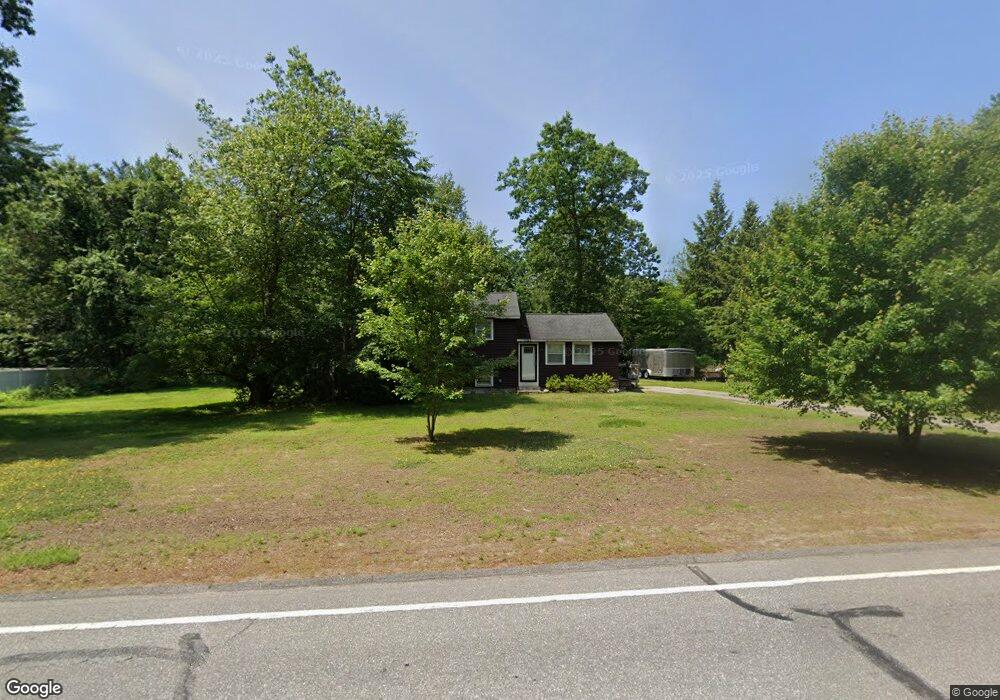
46 Wire Rd MerriMacK, NH 03054
Estimated Value: $491,901 - $559,000
3
Beds
1
Bath
1,816
Sq Ft
$290/Sq Ft
Est. Value
About This Home
This home is located at 46 Wire Rd, MerriMacK, NH 03054 and is currently estimated at $526,725, approximately $290 per square foot. 46 Wire Rd is a home located in Hillsborough County with nearby schools including Reeds Ferry School, James Mastricola Upper Elementary School, and Merrimack Middle School.
Ownership History
Date
Name
Owned For
Owner Type
Purchase Details
Closed on
Feb 13, 2001
Sold by
Lukkarinen Aimo A
Bought by
Harvey Glenn E
Current Estimated Value
Purchase Details
Closed on
Dec 9, 1998
Sold by
Viggiano Michael P
Bought by
Lukkarinen Aimo A and Lukkarinen June C
Create a Home Valuation Report for This Property
The Home Valuation Report is an in-depth analysis detailing your home's value as well as a comparison with similar homes in the area
Home Values in the Area
Average Home Value in this Area
Purchase History
| Date | Buyer | Sale Price | Title Company |
|---|---|---|---|
| Harvey Glenn E | $165,000 | -- | |
| Lukkarinen Aimo A | $115,000 | -- |
Source: Public Records
Mortgage History
| Date | Status | Borrower | Loan Amount |
|---|---|---|---|
| Open | Lukkarinen Aimo A | $134,000 | |
| Closed | Lukkarinen Aimo A | $134,000 | |
| Closed | Lukkarinen Aimo A | $145,000 | |
| Closed | Lukkarinen Aimo A | $25,000 |
Source: Public Records
Tax History
| Year | Tax Paid | Tax Assessment Tax Assessment Total Assessment is a certain percentage of the fair market value that is determined by local assessors to be the total taxable value of land and additions on the property. | Land | Improvement |
|---|---|---|---|---|
| 2025 | $7,294 | $329,900 | $183,700 | $146,200 |
| 2024 | $6,826 | $329,900 | $183,700 | $146,200 |
| 2023 | $6,417 | $329,900 | $183,700 | $146,200 |
| 2022 | $5,734 | $329,900 | $183,700 | $146,200 |
| 2021 | $5,664 | $329,900 | $183,700 | $146,200 |
| 2020 | $5,534 | $230,000 | $125,400 | $104,600 |
| 2019 | $5,550 | $230,000 | $125,400 | $104,600 |
| 2018 | $5,393 | $223,600 | $125,400 | $98,200 |
| 2017 | $5,226 | $223,600 | $125,400 | $98,200 |
| 2016 | $5,096 | $223,600 | $125,400 | $98,200 |
| 2015 | $4,996 | $202,100 | $113,500 | $88,600 |
| 2014 | $4,982 | $206,800 | $113,500 | $93,300 |
| 2013 | $4,945 | $206,800 | $113,500 | $93,300 |
Source: Public Records
Map
Nearby Homes
Your Personal Tour Guide
Ask me questions while you tour the home.