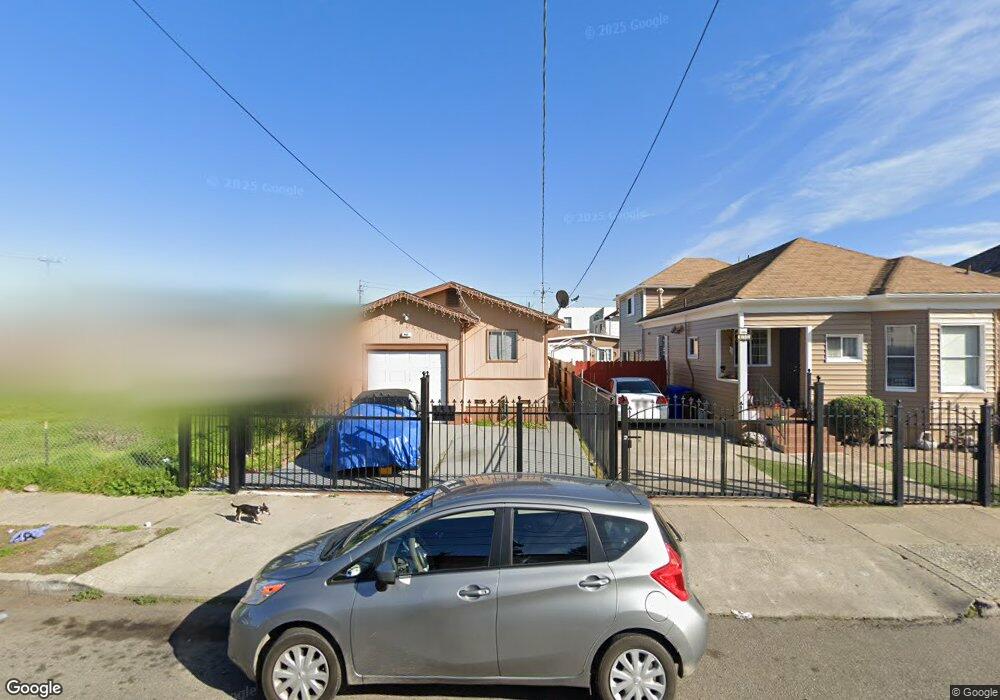
460 21st St Richmond, CA 94801
Belding Woods NeighborhoodEstimated Value: $475,000 - $578,000
3
Beds
2
Baths
994
Sq Ft
$508/Sq Ft
Est. Value
About This Home
This home is located at 460 21st St, Richmond, CA 94801 and is currently estimated at $505,320, approximately $508 per square foot. 460 21st St is a home located in Contra Costa County with nearby schools including Grant Elementary School, Lovonya DeJean Middle School, and John F. Kennedy High School.
Ownership History
Date
Name
Owned For
Owner Type
Purchase Details
Closed on
Aug 19, 2015
Sold by
Dominguez Eduardo A
Bought by
Narvaez Patricia Mendoza and Baltodano Roberto J
Current Estimated Value
Home Financials for this Owner
Home Financials are based on the most recent Mortgage that was taken out on this home.
Original Mortgage
$304,385
Outstanding Balance
$239,560
Interest Rate
4.05%
Mortgage Type
FHA
Estimated Equity
$265,760
Purchase Details
Closed on
Feb 24, 2015
Sold by
Campos Jesus
Bought by
Dominguez Eduardo A
Home Financials for this Owner
Home Financials are based on the most recent Mortgage that was taken out on this home.
Original Mortgage
$147,000
Interest Rate
3.6%
Mortgage Type
New Conventional
Purchase Details
Closed on
Aug 25, 2008
Sold by
Deutsche Bank National Trust Co
Bought by
Campos Jesus
Home Financials for this Owner
Home Financials are based on the most recent Mortgage that was taken out on this home.
Original Mortgage
$131,750
Interest Rate
6.59%
Mortgage Type
Purchase Money Mortgage
Purchase Details
Closed on
Feb 6, 2008
Sold by
Martinez Maria Zenaida and Martinez Zenaida Guadalupe
Bought by
Deutsche Bank Nationa Trust Co
Purchase Details
Closed on
Apr 27, 2006
Sold by
Martinez Maria Z
Bought by
Martinez Zenaida G
Purchase Details
Closed on
Oct 4, 2005
Sold by
Lainez Jose and Arredondo Martha A
Bought by
Martinez Maria Zenaida and Martinez Zenaida Guadalupe
Home Financials for this Owner
Home Financials are based on the most recent Mortgage that was taken out on this home.
Original Mortgage
$87,000
Interest Rate
5.7%
Mortgage Type
Stand Alone Second
Purchase Details
Closed on
May 27, 2003
Sold by
Pastora Rene M and Pastora Lucia
Bought by
Lainez Jose and Arredondo Martha A
Home Financials for this Owner
Home Financials are based on the most recent Mortgage that was taken out on this home.
Original Mortgage
$208,000
Interest Rate
5.71%
Mortgage Type
Stand Alone First
Create a Home Valuation Report for This Property
The Home Valuation Report is an in-depth analysis detailing your home's value as well as a comparison with similar homes in the area
Home Values in the Area
Average Home Value in this Area
Purchase History
| Date | Buyer | Sale Price | Title Company |
|---|---|---|---|
| Narvaez Patricia Mendoza | $310,000 | Old Republic Title Company | |
| Dominguez Eduardo A | $210,000 | Ortc | |
| Campos Jesus | $155,000 | Chicago Title Company | |
| Deutsche Bank Nationa Trust Co | $188,000 | None Available | |
| Martinez Zenaida G | -- | None Available | |
| Martinez Maria Zenaida | $435,000 | Alliance Title | |
| Lainez Jose | $260,000 | Chicago Title |
Source: Public Records
Mortgage History
| Date | Status | Borrower | Loan Amount |
|---|---|---|---|
| Open | Narvaez Patricia Mendoza | $304,385 | |
| Previous Owner | Dominguez Eduardo A | $147,000 | |
| Previous Owner | Campos Jesus | $131,750 | |
| Previous Owner | Martinez Maria Zenaida | $87,000 | |
| Previous Owner | Lainez Jose | $208,000 |
Source: Public Records
Tax History Compared to Growth
Tax History
| Year | Tax Paid | Tax Assessment Tax Assessment Total Assessment is a certain percentage of the fair market value that is determined by local assessors to be the total taxable value of land and additions on the property. | Land | Improvement |
|---|---|---|---|---|
| 2025 | $6,593 | $366,968 | $243,503 | $123,465 |
| 2024 | $6,496 | $359,774 | $238,729 | $121,045 |
| 2023 | $6,496 | $352,721 | $234,049 | $118,672 |
| 2022 | $6,367 | $345,806 | $229,460 | $116,346 |
| 2021 | $6,293 | $339,026 | $224,961 | $114,065 |
| 2019 | $5,911 | $328,973 | $218,290 | $110,683 |
| 2018 | $5,703 | $322,523 | $214,010 | $108,513 |
| 2017 | $5,569 | $316,200 | $209,814 | $106,386 |
| 2016 | $5,489 | $310,000 | $205,700 | $104,300 |
| 2015 | $3,437 | $166,075 | $117,861 | $48,214 |
| 2014 | $3,428 | $156,000 | $110,711 | $45,289 |
Source: Public Records
Map
Nearby Homes