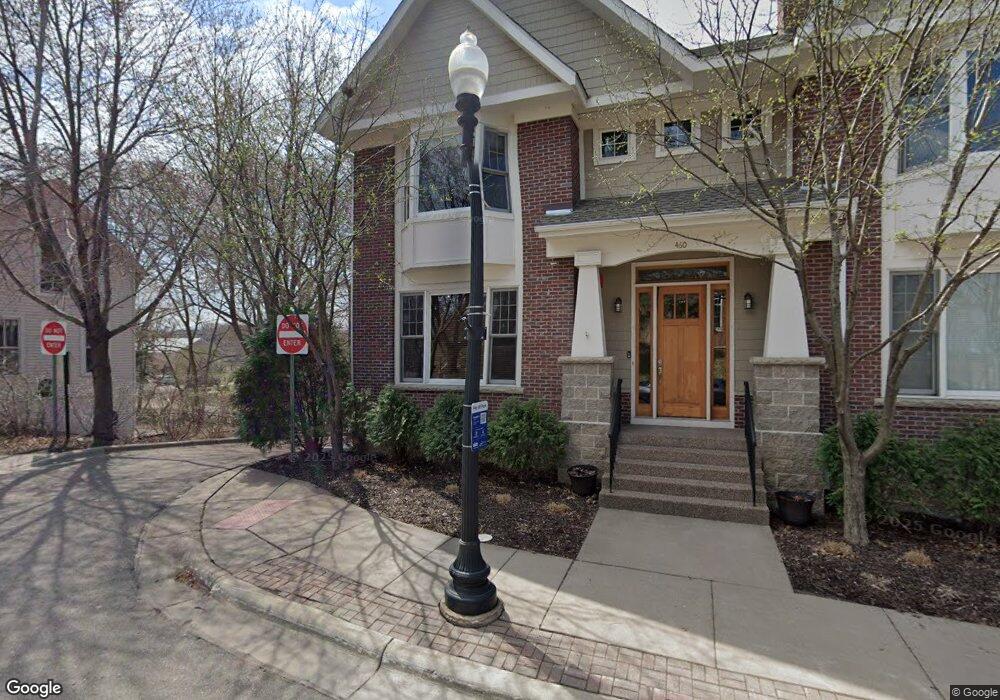
460 3rd St Excelsior, MN 55331
Estimated Value: $823,000 - $1,006,000
2
Beds
3
Baths
1,872
Sq Ft
$494/Sq Ft
Est. Value
About This Home
This home is located at 460 3rd St, Excelsior, MN 55331 and is currently estimated at $925,312, approximately $494 per square foot. 460 3rd St is a home located in Hennepin County with nearby schools including Excelsior Elementary School, Minnetonka West Middle School, and Minnetonka Senior High School.
Ownership History
Date
Name
Owned For
Owner Type
Purchase Details
Closed on
Feb 22, 2019
Sold by
Hertiq Joseph W and Atkinson Hertiq Janet M
Bought by
B & N Llc
Current Estimated Value
Purchase Details
Closed on
Aug 15, 2013
Sold by
Shv Inc
Bought by
Hertig Joseph W and Atkinson Hertig Janet M
Home Financials for this Owner
Home Financials are based on the most recent Mortgage that was taken out on this home.
Original Mortgage
$350,320
Interest Rate
4.53%
Mortgage Type
New Conventional
Create a Home Valuation Report for This Property
The Home Valuation Report is an in-depth analysis detailing your home's value as well as a comparison with similar homes in the area
Home Values in the Area
Average Home Value in this Area
Purchase History
| Date | Buyer | Sale Price | Title Company |
|---|---|---|---|
| B & N Llc | $629,000 | Burnet Title | |
| Hertig Joseph W | $437,900 | Burnet Title |
Source: Public Records
Mortgage History
| Date | Status | Borrower | Loan Amount |
|---|---|---|---|
| Previous Owner | Hertig Joseph W | $350,320 |
Source: Public Records
Tax History
| Year | Tax Paid | Tax Assessment Tax Assessment Total Assessment is a certain percentage of the fair market value that is determined by local assessors to be the total taxable value of land and additions on the property. | Land | Improvement |
|---|---|---|---|---|
| 2024 | $11,491 | $888,000 | $392,000 | $496,000 |
| 2023 | $10,308 | $826,800 | $350,000 | $476,800 |
| 2022 | $7,926 | $749,000 | $292,000 | $457,000 |
| 2021 | $8,345 | $591,000 | $225,000 | $366,000 |
| 2020 | $8,217 | $619,000 | $280,000 | $339,000 |
| 2019 | $7,776 | $594,000 | $260,000 | $334,000 |
| 2018 | $5,979 | $552,000 | $210,000 | $342,000 |
| 2017 | $6,287 | $460,000 | $180,000 | $280,000 |
| 2016 | $6,390 | $457,000 | $176,000 | $281,000 |
| 2015 | $5,904 | $416,000 | $135,000 | $281,000 |
| 2014 | -- | $349,000 | $81,000 | $268,000 |
Source: Public Records
Map
Nearby Homes
Your Personal Tour Guide
Ask me questions while you tour the home.