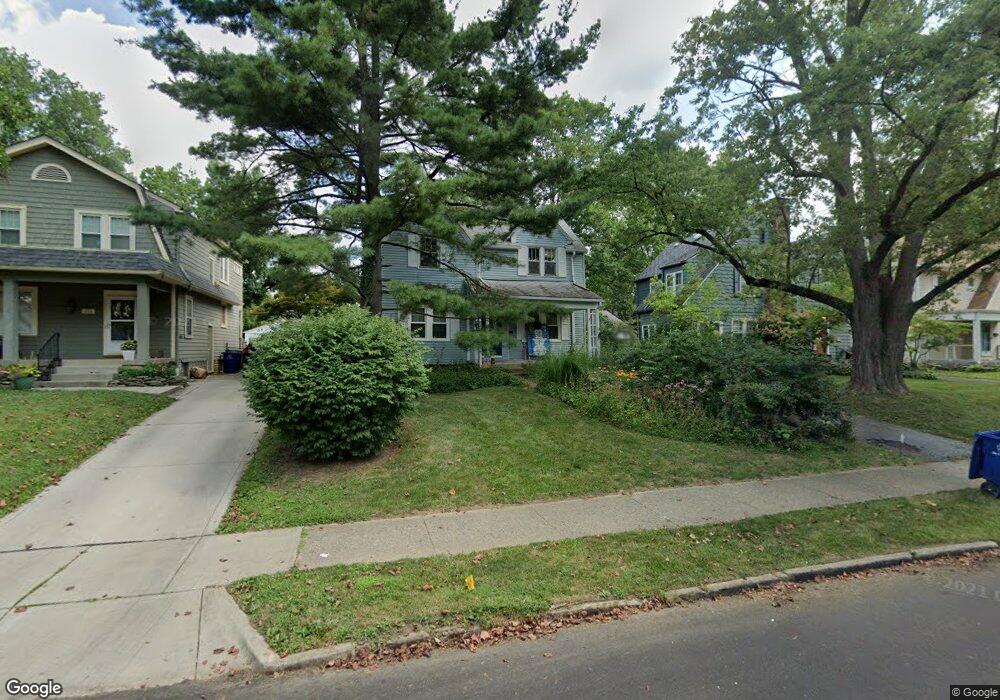
460 Brevoort Rd Columbus, OH 43214
Clintonville NeighborhoodEstimated Value: $375,000 - $484,000
3
Beds
2
Baths
1,436
Sq Ft
$306/Sq Ft
Est. Value
About This Home
This home is located at 460 Brevoort Rd, Columbus, OH 43214 and is currently estimated at $438,786, approximately $305 per square foot. 460 Brevoort Rd is a home located in Franklin County with nearby schools including Clinton Elementary School, Dominion Middle School, and Whetstone High School.
Ownership History
Date
Name
Owned For
Owner Type
Purchase Details
Closed on
Dec 8, 2023
Sold by
Campden Properties Llc
Bought by
Fricker Marc Andrew and Sunderman Michelle Marie
Current Estimated Value
Home Financials for this Owner
Home Financials are based on the most recent Mortgage that was taken out on this home.
Original Mortgage
$300,000
Outstanding Balance
$293,927
Interest Rate
7.44%
Mortgage Type
Credit Line Revolving
Estimated Equity
$144,859
Purchase Details
Closed on
Feb 9, 2023
Sold by
Baker Barry
Bought by
Campden Properties Llc
Purchase Details
Closed on
Jan 7, 2013
Sold by
Soter Linda T
Bought by
Soter Peter S
Purchase Details
Closed on
Jul 13, 2007
Sold by
Soter Peter S and Soter Linda T
Bought by
Soter Peter S and Soter Linda T
Purchase Details
Closed on
May 17, 1974
Bought by
Soter Peter S
Create a Home Valuation Report for This Property
The Home Valuation Report is an in-depth analysis detailing your home's value as well as a comparison with similar homes in the area
Home Values in the Area
Average Home Value in this Area
Purchase History
| Date | Buyer | Sale Price | Title Company |
|---|---|---|---|
| Fricker Marc Andrew | $375,000 | Title Connect Agency | |
| Campden Properties Llc | $339,350 | Ohio Title | |
| Soter Peter S | -- | None Available | |
| Soter Peter S | -- | Attorney | |
| Soter Peter S | -- | -- |
Source: Public Records
Mortgage History
| Date | Status | Borrower | Loan Amount |
|---|---|---|---|
| Open | Fricker Marc Andrew | $300,000 |
Source: Public Records
Tax History
| Year | Tax Paid | Tax Assessment Tax Assessment Total Assessment is a certain percentage of the fair market value that is determined by local assessors to be the total taxable value of land and additions on the property. | Land | Improvement |
|---|---|---|---|---|
| 2025 | $6,049 | $134,790 | $56,600 | $78,190 |
| 2024 | $6,049 | $134,790 | $56,600 | $78,190 |
| 2023 | $6,144 | $133,950 | $56,600 | $77,350 |
| 2022 | $10,502 | $120,440 | $36,930 | $83,510 |
| 2021 | $6,407 | $120,440 | $36,930 | $83,510 |
| 2020 | $6,266 | $120,440 | $36,930 | $83,510 |
| 2019 | $5,614 | $92,550 | $28,390 | $64,160 |
| 2018 | $5,212 | $92,550 | $28,390 | $64,160 |
| 2017 | $5,462 | $92,550 | $28,390 | $64,160 |
| 2016 | $5,312 | $80,190 | $31,640 | $48,550 |
| 2015 | $4,822 | $80,190 | $31,640 | $48,550 |
| 2014 | $4,834 | $80,190 | $31,640 | $48,550 |
| 2013 | $2,321 | $76,370 | $30,135 | $46,235 |
Source: Public Records
Map
Nearby Homes
- 467 Brevoort Rd
- 528 Arden Rd
- 440 Chatham Rd
- 541 Northridge Rd
- 780 Moon Rd
- 3546 Beulah Rd
- 83 Clinton Heights Ave
- 3468 Kimberly Ave Unit 470
- 296 Walhalla Rd
- 612 E Como Ave
- 886 Carolyn Ave
- 4000 Indianola Ave
- 76 E Lakeview Ave
- 36 Brighton Rd
- 341 Canyon Dr N
- 759 E Longview Ave
- 126 Orchard Ln
- 40 E Lakeview Ave
- 991 Hidden Acres Ct Unit 991
- 164 Tibet Rd
- 466 Brevoort Rd
- 454 Brevoort Rd
- 474 Brevoort Rd
- 448 Brevoort Rd
- 469 E Torrence Rd
- 480 Brevoort Rd
- 440 Brevoort Rd
- 475 E Torrence Rd
- 461 E Torrence Rd
- 481 E Torrence Rd
- 455 E Torrence Rd
- 486 Brevoort Rd
- 434 Brevoort Rd
- 461 Brevoort Rd
- 455 Brevoort Rd
- 487 E Torrence Rd
- 449 E Torrence Rd
- 447 Brevoort Rd
- 473 Brevoort Rd
- 441 Brevoort Rd