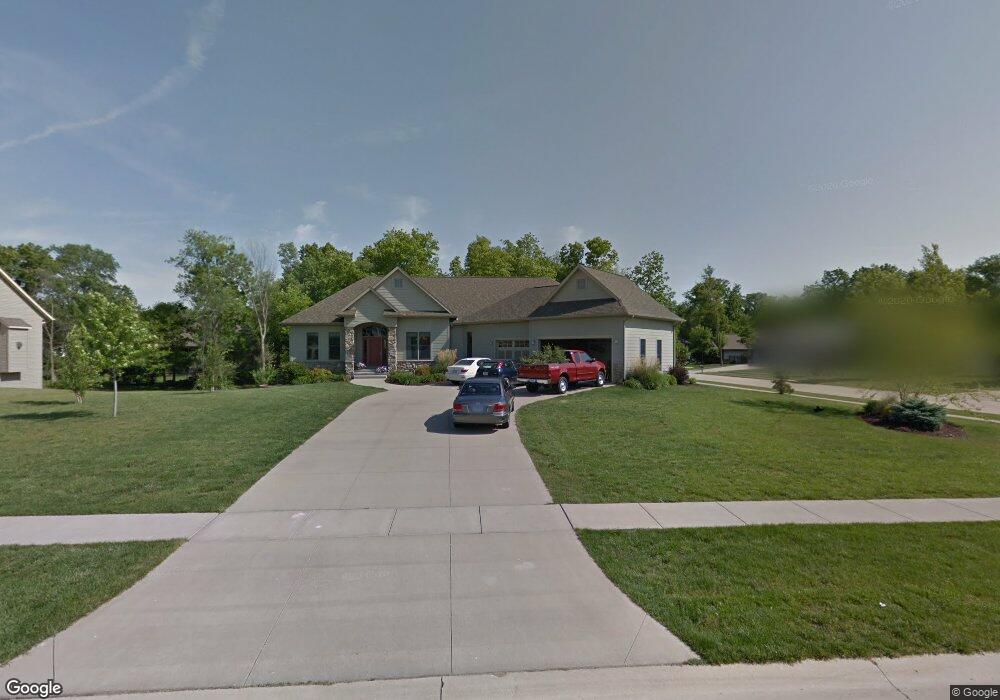
460 Cypress Ct Robins, IA 52328
Estimated Value: $656,000 - $752,000
5
Beds
4
Baths
5,300
Sq Ft
$133/Sq Ft
Est. Value
About This Home
This home is located at 460 Cypress Ct, Robins, IA 52328 and is currently estimated at $706,419, approximately $133 per square foot. 460 Cypress Ct is a home located in Linn County with nearby schools including Echo Hill Elementary School, Oak Ridge School, and Linn-Mar High School.
Ownership History
Date
Name
Owned For
Owner Type
Purchase Details
Closed on
Sep 18, 2011
Sold by
Thornton Brandon S and Thornton Brenda L
Bought by
Brinkman Garrett P and Brinkman Kelly A
Current Estimated Value
Home Financials for this Owner
Home Financials are based on the most recent Mortgage that was taken out on this home.
Original Mortgage
$494,100
Outstanding Balance
$338,195
Interest Rate
4.25%
Mortgage Type
New Conventional
Estimated Equity
$368,224
Purchase Details
Closed on
Oct 25, 2005
Sold by
Hughes Brian C and Hughes Wanda M
Bought by
Thornton Brandon S and Thornton Brenda L
Purchase Details
Closed on
Oct 20, 2005
Sold by
Statley James Homes Corp
Bought by
Hughes Brian C and Hughes Wanda M
Purchase Details
Closed on
Oct 14, 2005
Sold by
Wiewel Holdings Llc
Bought by
Hughes Brian C and Hughes Wanda M
Create a Home Valuation Report for This Property
The Home Valuation Report is an in-depth analysis detailing your home's value as well as a comparison with similar homes in the area
Home Values in the Area
Average Home Value in this Area
Purchase History
| Date | Buyer | Sale Price | Title Company |
|---|---|---|---|
| Brinkman Garrett P | $548,500 | None Available | |
| Thornton Brandon S | $81,500 | None Available | |
| Hughes Brian C | -- | None Available | |
| Hughes Brian C | $70,000 | None Available | |
| Wiewel Holdings Llc | $47,497 | None Available |
Source: Public Records
Mortgage History
| Date | Status | Borrower | Loan Amount |
|---|---|---|---|
| Open | Brinkman Garrett P | $494,100 |
Source: Public Records
Tax History Compared to Growth
Tax History
| Year | Tax Paid | Tax Assessment Tax Assessment Total Assessment is a certain percentage of the fair market value that is determined by local assessors to be the total taxable value of land and additions on the property. | Land | Improvement |
|---|---|---|---|---|
| 2025 | $10,582 | $669,900 | $102,800 | $567,100 |
| 2024 | $8,796 | $687,500 | $102,800 | $584,700 |
| 2023 | $8,796 | $687,500 | $102,800 | $584,700 |
| 2022 | $9,130 | $517,300 | $102,800 | $414,500 |
| 2021 | $10,148 | $517,300 | $102,800 | $414,500 |
| 2020 | $10,148 | $536,700 | $102,800 | $433,900 |
| 2019 | $9,936 | $536,700 | $102,800 | $433,900 |
| 2018 | $9,584 | $527,100 | $102,800 | $424,300 |
| 2017 | $9,584 | $530,700 | $102,800 | $427,900 |
| 2016 | $9,722 | $530,700 | $102,800 | $427,900 |
| 2015 | $9,750 | $530,700 | $102,800 | $427,900 |
| 2014 | $9,750 | $530,700 | $102,800 | $427,900 |
| 2013 | $9,398 | $530,700 | $102,800 | $427,900 |
Source: Public Records
Map
Nearby Homes
- 210 Brougham Rd
- 325 Landau St
- 545 Evergreen Ln
- 0 Maple St
- 525 Chestnut Dr
- 1275 E Knoll Dr
- 9124 Grand Oaks Dr NE
- 8926 Norway Dr NE
- 8809 Middlebury Ct NE
- 8908 Norway Dr NE
- 745 Eastview Dr
- 8615 Harrington Dr NE
- 1321 Winchell Dr NE
- 9615 Grand Oaks Dr NE
- 495 Woodview Ave
- 199 Shelly Dr
- 70.78 Acres M L Quass Rd
- 225 Meadows Field Dr NE
- 219 Meadows Field Dr NE
- 923 Messina Dr NE
- 450 Cypress Ct
- 465 Hickory Ct
- 380 Evergreen Ln
- 455 Hickory Ct
- 390 Evergreen Ln
- 465 Cypress Ct
- 370 Evergreen Ln
- 455 Cypress Ct
- 440 Cypress Ct
- 400 Evergreen Ln
- 445 Hickory Ct
- 360 Evergreen Ln
- 445 Cypress Ct
- 410 Evergreen Ln
- 460 Hickory Ct
- 370 Brougham Rd
- 350 Brougham Rd
- 450 Hickory Ct
- 390 Brougham Rd
- 330 Brougham Rd