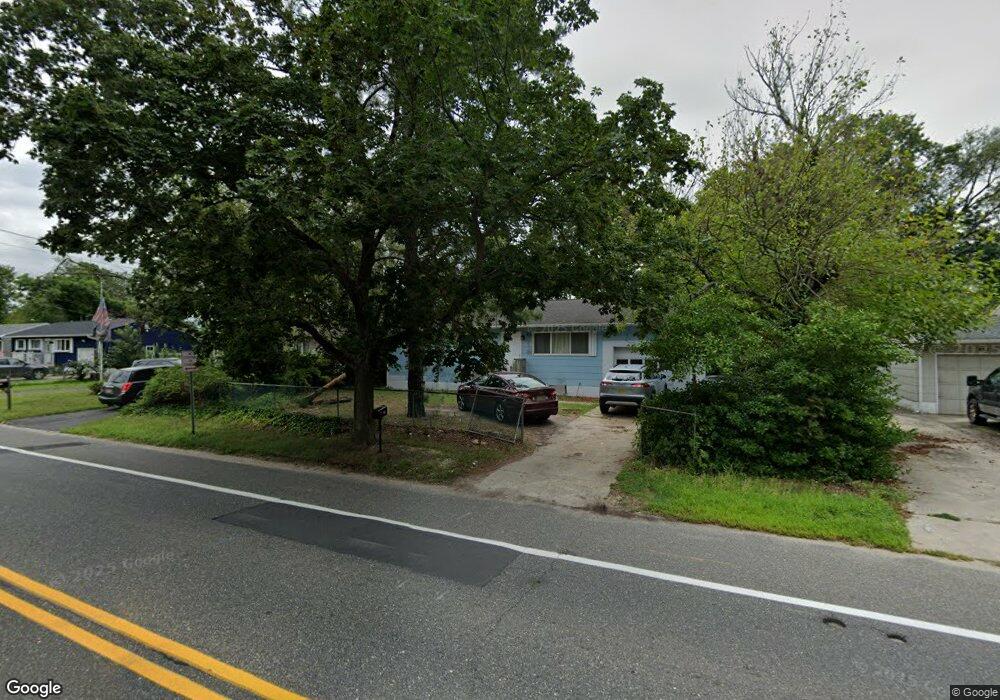
460 Dover Rd Toms River, NJ 08757
Estimated Value: $365,950 - $386,000
3
Beds
1
Bath
1,728
Sq Ft
$217/Sq Ft
Est. Value
About This Home
This home is located at 460 Dover Rd, Toms River, NJ 08757 and is currently estimated at $374,488, approximately $216 per square foot. 460 Dover Rd is a home located in Ocean County with nearby schools including St Joseph Grade School, Ambassador Christian Academy, and Ocean Academy.
Ownership History
Date
Name
Owned For
Owner Type
Purchase Details
Closed on
Aug 5, 2013
Sold by
Rei Iq Investors Llc
Bought by
Oak Tree Equities Llc
Current Estimated Value
Purchase Details
Closed on
Sep 13, 2004
Sold by
Rappa Peter and Rappa Fred
Bought by
Vasquez Edgar A
Home Financials for this Owner
Home Financials are based on the most recent Mortgage that was taken out on this home.
Original Mortgage
$170,000
Interest Rate
5.89%
Mortgage Type
Fannie Mae Freddie Mac
Create a Home Valuation Report for This Property
The Home Valuation Report is an in-depth analysis detailing your home's value as well as a comparison with similar homes in the area
Home Values in the Area
Average Home Value in this Area
Purchase History
| Date | Buyer | Sale Price | Title Company |
|---|---|---|---|
| Oak Tree Equities Llc | -- | None Available | |
| Vasquez Edgar A | $179,000 | Lawyers Title Insurance Corp |
Source: Public Records
Mortgage History
| Date | Status | Borrower | Loan Amount |
|---|---|---|---|
| Previous Owner | Vasquez Edgar A | $170,000 |
Source: Public Records
Tax History Compared to Growth
Tax History
| Year | Tax Paid | Tax Assessment Tax Assessment Total Assessment is a certain percentage of the fair market value that is determined by local assessors to be the total taxable value of land and additions on the property. | Land | Improvement |
|---|---|---|---|---|
| 2025 | $4,715 | $143,500 | $55,300 | $88,200 |
| 2024 | $4,549 | $143,500 | $55,300 | $88,200 |
| 2023 | $4,433 | $143,500 | $55,300 | $88,200 |
| 2022 | $4,433 | $143,500 | $55,300 | $88,200 |
| 2021 | $4,395 | $143,500 | $55,300 | $88,200 |
| 2020 | $4,283 | $143,500 | $55,300 | $88,200 |
| 2019 | $4,242 | $143,500 | $55,300 | $88,200 |
| 2018 | $4,166 | $143,500 | $55,300 | $88,200 |
| 2017 | $4,108 | $143,500 | $55,300 | $88,200 |
| 2016 | $4,009 | $143,500 | $55,300 | $88,200 |
| 2015 | $3,288 | $150,600 | $85,000 | $65,600 |
| 2014 | $4,057 | $193,100 | $100,000 | $93,100 |
Source: Public Records
Map
Nearby Homes