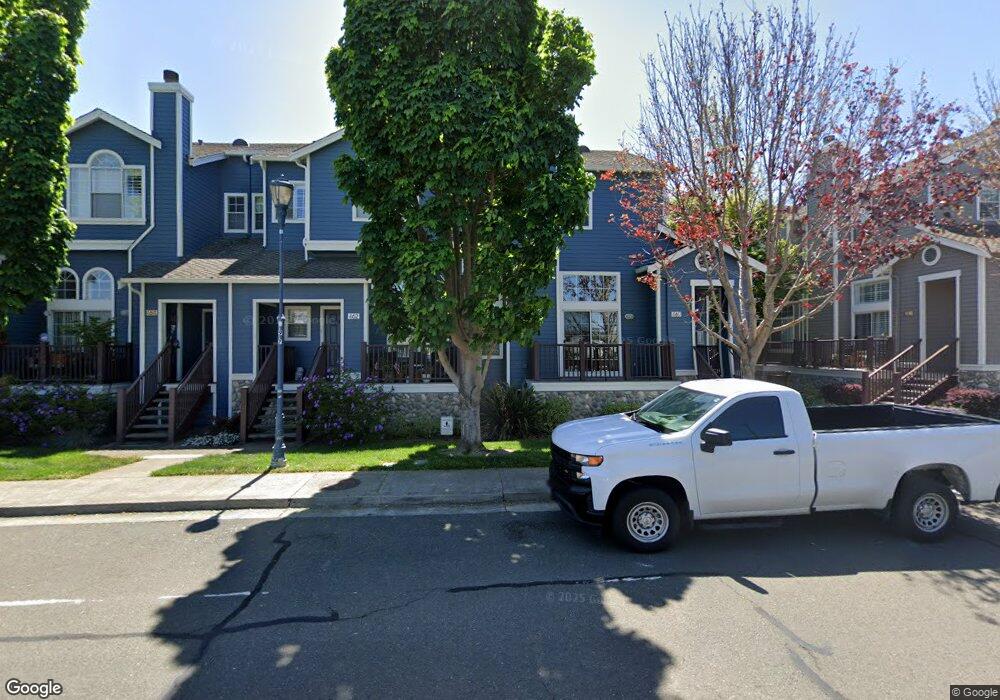
460 E E St Benicia, CA 94510
Estimated Value: $641,000 - $767,000
3
Beds
3
Baths
1,640
Sq Ft
$422/Sq Ft
Est. Value
About This Home
This home is located at 460 E E St, Benicia, CA 94510 and is currently estimated at $691,613, approximately $421 per square foot. 460 E E St is a home located in Solano County with nearby schools including Mary Farmar Elementary School, Benicia Middle School, and Benicia High School.
Ownership History
Date
Name
Owned For
Owner Type
Purchase Details
Closed on
Mar 18, 2014
Sold by
Horn Victoria Ellen Van
Bought by
Bodesland Llc
Current Estimated Value
Purchase Details
Closed on
Dec 8, 2010
Sold by
Gosney Gregory A and Bizzare Carla S
Bought by
North Lee and North Susan
Purchase Details
Closed on
Dec 15, 2003
Sold by
French John N and French Neala J
Bought by
Gosney Gregory A and Bizzare Carla S
Home Financials for this Owner
Home Financials are based on the most recent Mortgage that was taken out on this home.
Original Mortgage
$360,000
Interest Rate
4.25%
Mortgage Type
Purchase Money Mortgage
Purchase Details
Closed on
Nov 4, 1998
Sold by
Kaufman & Broad Of Northern Ca Inc
Bought by
French John N and French Neala J
Home Financials for this Owner
Home Financials are based on the most recent Mortgage that was taken out on this home.
Original Mortgage
$168,100
Interest Rate
6.61%
Create a Home Valuation Report for This Property
The Home Valuation Report is an in-depth analysis detailing your home's value as well as a comparison with similar homes in the area
Purchase History
| Date | Buyer | Sale Price | Title Company |
|---|---|---|---|
| Bodesland Llc | -- | None Available | |
| Bodesland Llc | -- | None Available | |
| Vanhorn Victoria Ellen | $179,000 | None Available | |
| North Lee | $235,000 | First American Title Company | |
| Gosney Gregory A | $450,000 | Placer Title Co | |
| French John N | $210,500 | First American Title |
Source: Public Records
Mortgage History
| Date | Status | Borrower | Loan Amount |
|---|---|---|---|
| Previous Owner | Gosney Gregory A | $360,000 | |
| Previous Owner | French John N | $168,100 | |
| Closed | Gosney Gregory A | $67,500 |
Source: Public Records
Tax History
| Year | Tax Paid | Tax Assessment Tax Assessment Total Assessment is a certain percentage of the fair market value that is determined by local assessors to be the total taxable value of land and additions on the property. | Land | Improvement |
|---|---|---|---|---|
| 2025 | $4,703 | $400,832 | $109,202 | $291,630 |
| 2024 | $4,703 | $392,973 | $107,061 | $285,912 |
| 2023 | $4,590 | $385,268 | $104,962 | $280,306 |
| 2022 | $4,505 | $377,714 | $102,904 | $274,810 |
| 2021 | $4,413 | $370,309 | $100,887 | $269,422 |
| 2020 | $4,355 | $366,513 | $99,853 | $266,660 |
| 2019 | $4,279 | $359,328 | $97,896 | $261,432 |
| 2018 | $4,170 | $352,283 | $95,977 | $256,306 |
| 2017 | $4,074 | $345,377 | $94,096 | $251,281 |
| 2016 | $4,105 | $338,605 | $92,251 | $246,354 |
| 2015 | $4,001 | $333,520 | $90,866 | $242,654 |
| 2014 | $2,970 | $245,604 | $78,384 | $167,220 |
Source: Public Records
Map
Nearby Homes
Your Personal Tour Guide
Ask me questions while you tour the home.