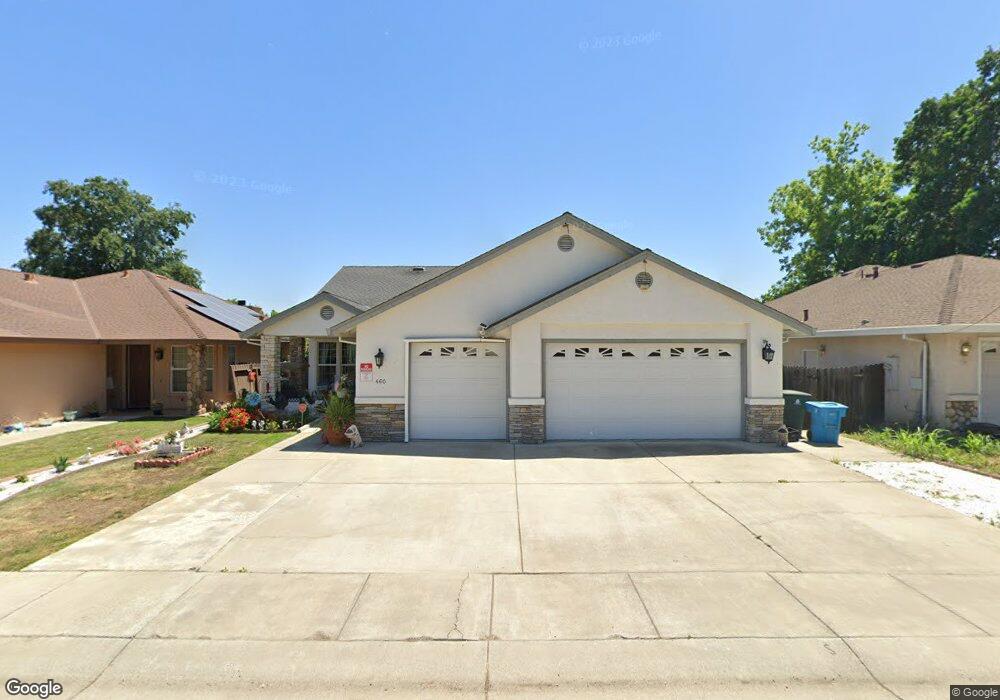
460 Grant Way Yuba City, CA 95991
Estimated Value: $297,000 - $482,000
3
Beds
2
Baths
1,822
Sq Ft
$222/Sq Ft
Est. Value
About This Home
This home is located at 460 Grant Way, Yuba City, CA 95991 and is currently estimated at $403,602, approximately $221 per square foot. 460 Grant Way is a home located in Sutter County with nearby schools including King Avenue Elementary School, Gray Avenue Middle School, and River Valley High School.
Ownership History
Date
Name
Owned For
Owner Type
Purchase Details
Closed on
May 7, 2008
Sold by
Fannie Mae
Bought by
Padgett Billie and Padgett Ethel
Current Estimated Value
Home Financials for this Owner
Home Financials are based on the most recent Mortgage that was taken out on this home.
Original Mortgage
$230,000
Outstanding Balance
$145,658
Interest Rate
5.88%
Mortgage Type
VA
Estimated Equity
$257,944
Purchase Details
Closed on
Nov 18, 2007
Sold by
Sotelo Gonzalo
Bought by
Federal National Mortgage Association
Purchase Details
Closed on
Jan 24, 2006
Sold by
Velazco Ana Celina Godinez
Bought by
Sotelo Gonzalo
Home Financials for this Owner
Home Financials are based on the most recent Mortgage that was taken out on this home.
Original Mortgage
$63,000
Interest Rate
6.21%
Mortgage Type
Stand Alone Second
Create a Home Valuation Report for This Property
The Home Valuation Report is an in-depth analysis detailing your home's value as well as a comparison with similar homes in the area
Home Values in the Area
Average Home Value in this Area
Purchase History
| Date | Buyer | Sale Price | Title Company |
|---|---|---|---|
| Padgett Billie | $230,000 | Placer Title Company | |
| Federal National Mortgage Association | $272,976 | None Available | |
| Sotelo Gonzalo | -- | Placer Title Company | |
| Sotelo Gonzalo | $315,000 | Placer Title Company |
Source: Public Records
Mortgage History
| Date | Status | Borrower | Loan Amount |
|---|---|---|---|
| Open | Padgett Billie | $230,000 | |
| Previous Owner | Sotelo Gonzalo | $63,000 | |
| Previous Owner | Sotelo Gonzalo | $252,000 |
Source: Public Records
Tax History Compared to Growth
Tax History
| Year | Tax Paid | Tax Assessment Tax Assessment Total Assessment is a certain percentage of the fair market value that is determined by local assessors to be the total taxable value of land and additions on the property. | Land | Improvement |
|---|---|---|---|---|
| 2025 | $1,652 | $316,804 | $78,802 | $238,002 |
| 2024 | $1,652 | $310,593 | $77,257 | $233,336 |
| 2023 | $1,652 | $304,504 | $75,743 | $228,761 |
| 2022 | $1,745 | $298,534 | $74,258 | $224,276 |
| 2021 | $1,720 | $292,691 | $72,809 | $219,882 |
| 2020 | $1,721 | $289,690 | $72,062 | $217,628 |
| 2019 | $1,696 | $284,009 | $70,649 | $213,360 |
| 2018 | $1,694 | $278,440 | $69,264 | $209,176 |
| 2017 | $1,667 | $272,980 | $67,906 | $205,074 |
| 2016 | $1,643 | $267,627 | $66,574 | $201,053 |
| 2015 | $1,608 | $263,607 | $65,574 | $198,033 |
| 2014 | $1,578 | $258,442 | $64,289 | $194,153 |
Source: Public Records
Map
Nearby Homes
- 540 Carroll St
- 1476 Wendell Way
- 1410 Upland Dr
- 0 Market St
- 1508 Upland Dr
- 1640 Melanie Ln
- 1307 Stafford Way
- 716 King Ave
- 1194 Rosemary Ln
- 771 April Ln
- 785 Regent Loop
- 790 Queens Ave
- 661 Cassidy Ave
- 1779 Tamarack Dr
- 811 Francis Way
- 1139 Casita Dr Unit 3
- 730 Rosalind Ave
- 726 Rosalind Ave
- 1136 Forestwood Dr
- 989 Northgate Dr