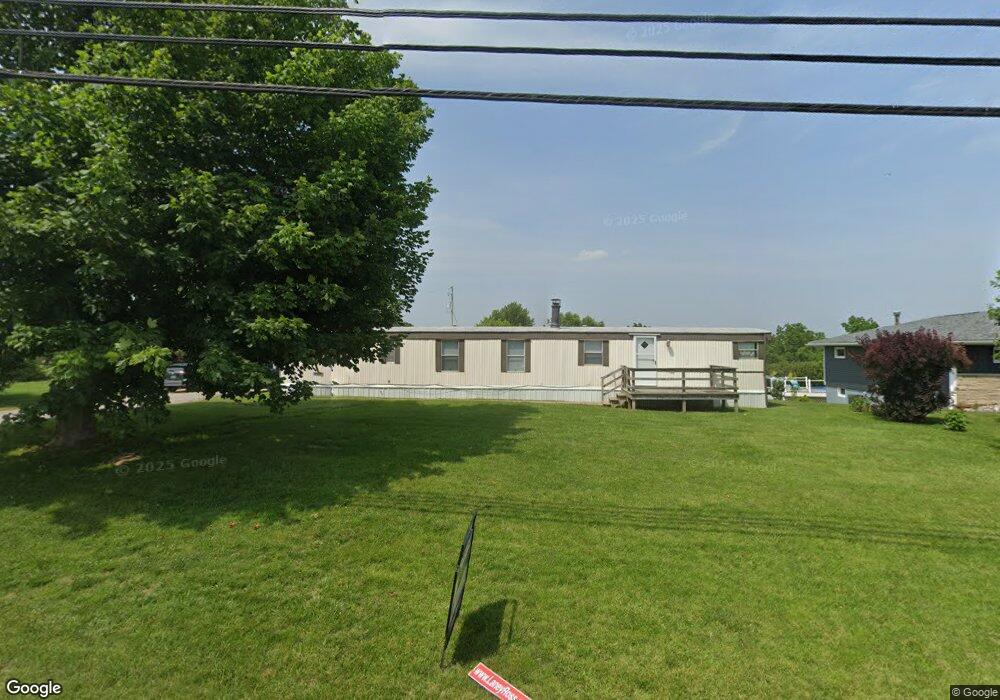
460 High St Flushing, OH 43977
Estimated Value: $114,000 - $168,533
3
Beds
1
Bath
1,374
Sq Ft
$103/Sq Ft
Est. Value
About This Home
This home is located at 460 High St, Flushing, OH 43977 and is currently estimated at $140,883, approximately $102 per square foot. 460 High St is a home located in Belmont County with nearby schools including Union Local Elementary School, Union Local Middle School, and Union Local High School.
Ownership History
Date
Name
Owned For
Owner Type
Purchase Details
Closed on
Jan 1, 1987
Sold by
Nucci Charles and Nucci Erin E
Bought by
Nucci Charles and Nucci Erin E
Current Estimated Value
Create a Home Valuation Report for This Property
The Home Valuation Report is an in-depth analysis detailing your home's value as well as a comparison with similar homes in the area
Purchase History
| Date | Buyer | Sale Price | Title Company |
|---|---|---|---|
| Nucci Charles | -- | -- |
Source: Public Records
Tax History
| Year | Tax Paid | Tax Assessment Tax Assessment Total Assessment is a certain percentage of the fair market value that is determined by local assessors to be the total taxable value of land and additions on the property. | Land | Improvement |
|---|---|---|---|---|
| 2025 | $1,778 | $46,890 | $3,890 | $43,000 |
| 2023 | $1,667 | $41,640 | $3,080 | $38,560 |
| 2022 | $1,667 | $41,647 | $3,084 | $38,563 |
| 2021 | $1,661 | $41,647 | $3,084 | $38,563 |
| 2020 | $1,540 | $36,220 | $2,680 | $33,540 |
| 2019 | $1,543 | $36,220 | $2,680 | $33,540 |
| 2018 | $1,536 | $36,220 | $2,680 | $33,540 |
| 2017 | $1,381 | $33,460 | $2,190 | $31,270 |
| 2016 | $1,386 | $33,460 | $2,190 | $31,270 |
| 2015 | $1,420 | $33,460 | $2,190 | $31,270 |
| 2014 | $1,212 | $28,050 | $2,000 | $26,050 |
| 2013 | $1,188 | $28,050 | $2,000 | $26,050 |
Source: Public Records
Map
Nearby Homes
- 41152 Black Oak Rd
- 117 A&B High St
- 39775 Rosemary Camp Rd
- 0 Holloway Rd State Rt 331 Unit 5067951
- 409 Ashton St
- 19 acres Saffell Rd
- 15 acres Saffell Rd
- 35 acres Saffell Rd
- 77900 Slater Rd
- 69680 Main St
- 68895 Lloydsville Bannock Rd
- INLOT 19 Havenwood
- 67174 Pancoast Rd S
- 71320 Church St
- 0 Rt 40 Rd
- 0 Moriah Dr Unit 5177567
- 0 Lloydsville St
- 38400 Cadiz-Piedmont Rd
- 125 Chaplins Ln
- V/L Shephard Rd
Your Personal Tour Guide
Ask me questions while you tour the home.