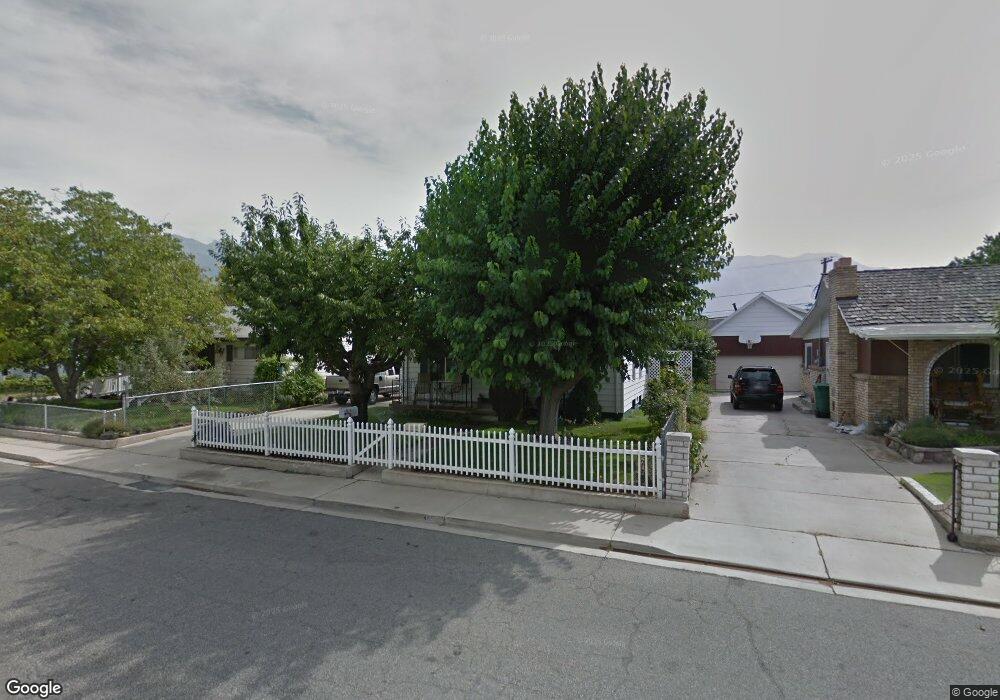
460 N Emery Ave Orem, UT 84057
Geneva NeighborhoodEstimated Value: $372,000 - $414,209
3
Beds
1
Bath
1,461
Sq Ft
$273/Sq Ft
Est. Value
About This Home
This home is located at 460 N Emery Ave, Orem, UT 84057 and is currently estimated at $398,736, approximately $272 per square foot. 460 N Emery Ave is a home located in Utah County with nearby schools including Orem Junior High School, Timpanogos High School, and Noah Webster Academy.
Ownership History
Date
Name
Owned For
Owner Type
Purchase Details
Closed on
Mar 27, 2024
Sold by
Elder Carolyn Janee and Macias Vladimir
Bought by
Elder Carolyn Janee and Macias Vladimir
Current Estimated Value
Home Financials for this Owner
Home Financials are based on the most recent Mortgage that was taken out on this home.
Original Mortgage
$366,208
Outstanding Balance
$360,621
Interest Rate
6.77%
Mortgage Type
FHA
Estimated Equity
$38,115
Purchase Details
Closed on
Mar 26, 2024
Sold by
Rolland And Betty Christiansen Family Re
Bought by
Elder Carolyn Janee and Macias Vladimir
Home Financials for this Owner
Home Financials are based on the most recent Mortgage that was taken out on this home.
Original Mortgage
$366,208
Outstanding Balance
$360,621
Interest Rate
6.77%
Mortgage Type
FHA
Estimated Equity
$38,115
Purchase Details
Closed on
Mar 11, 1998
Sold by
Christiansen Roland K and Christiansen Rolland K
Bought by
Christiansen Rolland K and Christiansen Betty K
Create a Home Valuation Report for This Property
The Home Valuation Report is an in-depth analysis detailing your home's value as well as a comparison with similar homes in the area
Home Values in the Area
Average Home Value in this Area
Purchase History
| Date | Buyer | Sale Price | Title Company |
|---|---|---|---|
| Elder Carolyn Janee | -- | Metro National Title | |
| Elder Carolyn Janee | -- | Inwest Title | |
| Christiansen Rolland K | -- | -- |
Source: Public Records
Mortgage History
| Date | Status | Borrower | Loan Amount |
|---|---|---|---|
| Open | Elder Carolyn Janee | $366,208 |
Source: Public Records
Tax History
| Year | Tax Paid | Tax Assessment Tax Assessment Total Assessment is a certain percentage of the fair market value that is determined by local assessors to be the total taxable value of land and additions on the property. | Land | Improvement |
|---|---|---|---|---|
| 2025 | $1,431 | $185,295 | -- | -- |
| 2024 | $1,431 | $175,010 | $0 | $0 |
| 2023 | $1,293 | $169,950 | $0 | $0 |
| 2022 | $1,397 | $177,925 | $0 | $0 |
| 2021 | $1,239 | $238,900 | $105,500 | $133,400 |
| 2020 | $1,129 | $213,900 | $84,400 | $129,500 |
| 2019 | $1,000 | $197,000 | $84,400 | $112,600 |
| 2018 | $951 | $179,000 | $81,100 | $97,900 |
| 2017 | $891 | $89,870 | $0 | $0 |
| 2016 | $780 | $72,545 | $0 | $0 |
| 2015 | $816 | $71,830 | $0 | $0 |
| 2014 | $774 | $67,815 | $0 | $0 |
Source: Public Records
Map
Nearby Homes
Your Personal Tour Guide
Ask me questions while you tour the home.