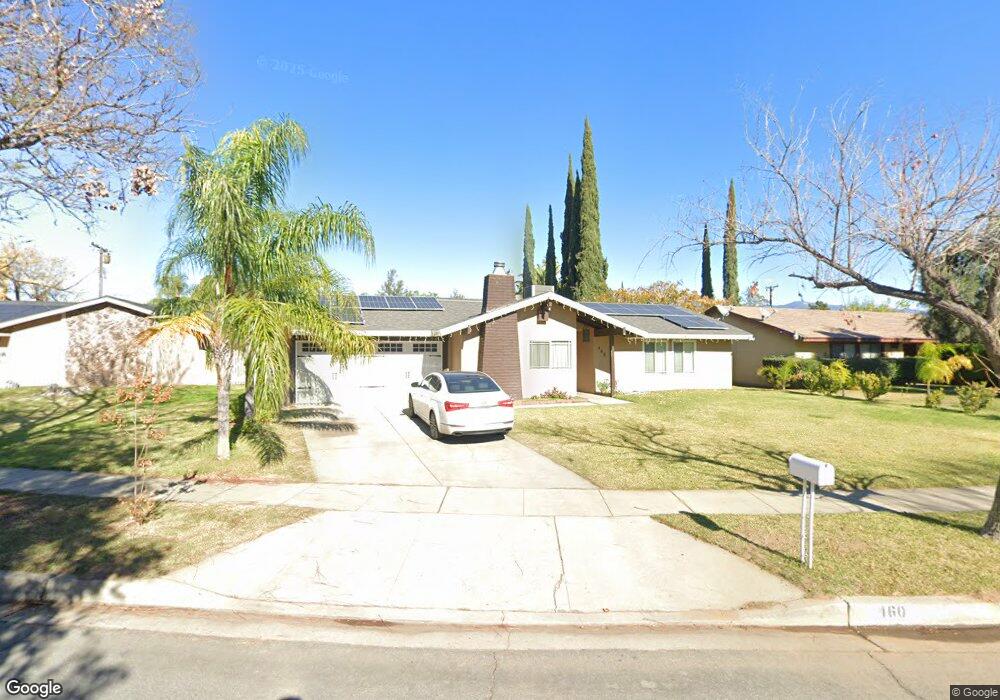
460 W Chaparral St Rialto, CA 92376
Estimated Value: $562,000 - $623,000
4
Beds
2
Baths
1,856
Sq Ft
$321/Sq Ft
Est. Value
About This Home
This home is located at 460 W Chaparral St, Rialto, CA 92376 and is currently estimated at $595,691, approximately $320 per square foot. 460 W Chaparral St is a home located in San Bernardino County with nearby schools including Preston Elementary School, Kolb Middle School, and Wilmer Amina Carter High School.
Ownership History
Date
Name
Owned For
Owner Type
Purchase Details
Closed on
Jun 6, 2023
Sold by
Montes Juan Guzman and Montes Gloria
Bought by
Guzman-Gonzalez Family Trust
Current Estimated Value
Purchase Details
Closed on
Mar 24, 2010
Sold by
Hackworth Jimmy B
Bought by
Hackworth Bonita Diane
Home Financials for this Owner
Home Financials are based on the most recent Mortgage that was taken out on this home.
Original Mortgage
$199,898
Interest Rate
4.31%
Mortgage Type
New Conventional
Purchase Details
Closed on
Feb 4, 2010
Sold by
Hackworth Bonita Diane and Stewart Bonita Diane
Bought by
Guzman Gonzalez Gloria and Guzman Montes Juan
Home Financials for this Owner
Home Financials are based on the most recent Mortgage that was taken out on this home.
Original Mortgage
$199,898
Interest Rate
4.31%
Mortgage Type
New Conventional
Create a Home Valuation Report for This Property
The Home Valuation Report is an in-depth analysis detailing your home's value as well as a comparison with similar homes in the area
Home Values in the Area
Average Home Value in this Area
Purchase History
| Date | Buyer | Sale Price | Title Company |
|---|---|---|---|
| Guzman-Gonzalez Family Trust | -- | None Listed On Document | |
| Hackworth Bonita Diane | -- | Nations Title Company | |
| Guzman Gonzalez Gloria | $190,000 | Nations Title Company |
Source: Public Records
Mortgage History
| Date | Status | Borrower | Loan Amount |
|---|---|---|---|
| Previous Owner | Guzman Gonzalez Gloria | $199,898 |
Source: Public Records
Tax History Compared to Growth
Tax History
| Year | Tax Paid | Tax Assessment Tax Assessment Total Assessment is a certain percentage of the fair market value that is determined by local assessors to be the total taxable value of land and additions on the property. | Land | Improvement |
|---|---|---|---|---|
| 2025 | $3,270 | $245,256 | $58,087 | $187,169 |
| 2024 | $3,270 | $240,447 | $56,948 | $183,499 |
| 2023 | $3,552 | $235,732 | $55,831 | $179,901 |
| 2022 | $3,290 | $231,110 | $54,736 | $176,374 |
| 2021 | $3,271 | $226,579 | $53,663 | $172,916 |
| 2020 | $3,281 | $224,256 | $53,113 | $171,143 |
| 2019 | $3,213 | $219,859 | $52,072 | $167,787 |
| 2018 | $3,108 | $215,548 | $51,051 | $164,497 |
| 2017 | $3,088 | $211,322 | $50,050 | $161,272 |
| 2016 | $2,718 | $207,179 | $49,069 | $158,110 |
| 2015 | $2,730 | $204,067 | $48,332 | $155,735 |
| 2014 | $2,567 | $200,069 | $47,385 | $152,684 |
Source: Public Records
Map
Nearby Homes
- 1861 N Lilac Ave
- 19487 Chaparral St
- 1839 N Millard Ave
- 1760 N Vista Ave
- 19449 Anaconda St
- 301 W Easton St
- 6795 Fillmore Ave
- 178 W Walnut Ave Unit D
- 19538 Cheshire St
- 19244 Casmalia St
- 6210 Riverside Ave
- 160 W Cascade Dr
- 763 W Virginia St
- 970 W Norwood St
- 1973 N Sage Ave
- 358 E Walnut Ave
- 2335 Powell Dr
- 1074 W Casmalia St
- 2425 N Fillmore Ave
- 1122 W Galway St
- 450 W Chaparral St
- 470 W Chaparral St
- 461 W Cromwell St
- 440 W Chaparral St
- 480 W Chaparral St
- 451 W Cromwell St
- 1819 N Lilac Ave
- 471 W Chaparral St
- 461 W Chaparral St
- 471 W Cromwell St
- 451 W Chaparral St
- 1840 N Vista Ave
- 1850 N Vista Ave
- 441 W Cromwell St
- 1871 N Lilac Ave
- 1809 N Lilac Ave
- 1860 N Vista Ave
- 441 W Chaparral St
- 1790 N Verde Ave
- 1870 N Vista Ave