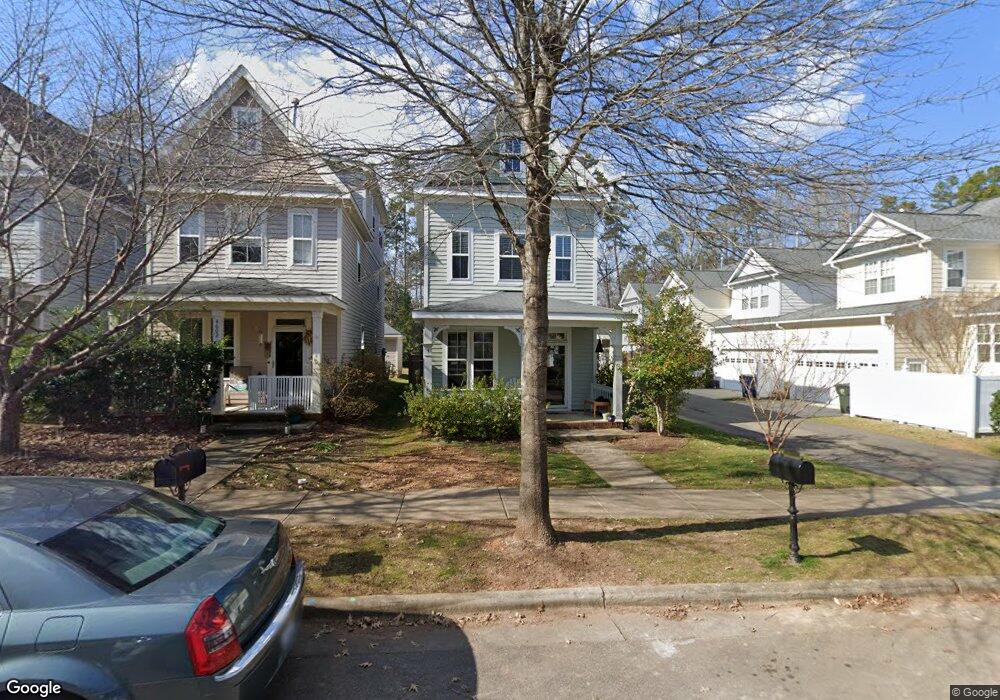
4600 All Points View Way Raleigh, NC 27614
Falls River NeighborhoodEstimated Value: $507,000 - $543,000
4
Beds
4
Baths
2,025
Sq Ft
$261/Sq Ft
Est. Value
About This Home
This home is located at 4600 All Points View Way, Raleigh, NC 27614 and is currently estimated at $527,672, approximately $260 per square foot. 4600 All Points View Way is a home located in Wake County with nearby schools including Abbotts Creek Elementary School, Wakefield Middle, and Wakefield High School.
Ownership History
Date
Name
Owned For
Owner Type
Purchase Details
Closed on
Aug 16, 2019
Sold by
Leiner Kevin and Leiner Jennifer M
Bought by
Becom Given Amanda
Current Estimated Value
Home Financials for this Owner
Home Financials are based on the most recent Mortgage that was taken out on this home.
Original Mortgage
$263,786
Outstanding Balance
$233,571
Interest Rate
4.25%
Mortgage Type
FHA
Estimated Equity
$294,101
Purchase Details
Closed on
Jan 26, 2007
Sold by
Arvida Mid Atlantic Homes Inc
Bought by
Leiner Kevin and Leiner Jennifer M
Home Financials for this Owner
Home Financials are based on the most recent Mortgage that was taken out on this home.
Original Mortgage
$194,364
Interest Rate
6.08%
Mortgage Type
Purchase Money Mortgage
Create a Home Valuation Report for This Property
The Home Valuation Report is an in-depth analysis detailing your home's value as well as a comparison with similar homes in the area
Home Values in the Area
Average Home Value in this Area
Purchase History
| Date | Buyer | Sale Price | Title Company |
|---|---|---|---|
| Becom Given Amanda | $305,000 | None Available | |
| Leiner Kevin | $259,500 | None Available |
Source: Public Records
Mortgage History
| Date | Status | Borrower | Loan Amount |
|---|---|---|---|
| Open | Becom Given Amanda | $263,786 | |
| Previous Owner | Leiner Kevin | $194,364 | |
| Previous Owner | Leiner Kevin | $64,788 |
Source: Public Records
Tax History Compared to Growth
Tax History
| Year | Tax Paid | Tax Assessment Tax Assessment Total Assessment is a certain percentage of the fair market value that is determined by local assessors to be the total taxable value of land and additions on the property. | Land | Improvement |
|---|---|---|---|---|
| 2025 | $4,899 | $559,400 | $100,000 | $459,400 |
| 2024 | $4,878 | $559,400 | $100,000 | $459,400 |
| 2023 | $3,600 | $328,453 | $60,000 | $268,453 |
| 2022 | $3,346 | $328,453 | $60,000 | $268,453 |
| 2021 | $3,216 | $328,453 | $60,000 | $268,453 |
| 2020 | $3,157 | $328,453 | $60,000 | $268,453 |
| 2019 | $3,063 | $262,537 | $40,000 | $222,537 |
| 2018 | $2,888 | $262,537 | $40,000 | $222,537 |
| 2017 | $2,751 | $262,537 | $40,000 | $222,537 |
| 2016 | $2,695 | $254,092 | $40,000 | $214,092 |
| 2015 | $2,494 | $238,951 | $44,000 | $194,951 |
| 2014 | $2,366 | $238,951 | $44,000 | $194,951 |
Source: Public Records
Map
Nearby Homes
- 4615 All Points View Way
- 10907 Flower Bed Ct
- 4405 All Points View Way
- 2051 Dunn Rd
- 1544 Nealstone Way
- 1804 Falls Landing Dr
- 1808 Falls Landing Dr
- 1911 Falls Landing Dr Unit 106
- 1901 Falls Landing Dr Unit 104
- 4201 Falls River Ave
- 10916 Farmville Rd
- 4109 Falls River Ave
- 10821 Farmville Rd
- 10817 Farmville Rd
- 2110 Piney Brook Rd Unit 104
- 2020 Hornbeck Ct
- 1904 Farmington Grove Dr
- 10816 Cokesbury Ln
- 2200 Valley Edge Dr
- 10205 Sorrills Creek Ln
- 4602 All Points View Way
- 4604 All Points View Way
- 11005 Flower Bed Ct
- 4606 All Points View Way
- 11007 Flower Bed Ct
- 11003 Flower Bed Ct
- 11009 Flower Bed Ct
- 2302 Dunlin Ln
- 10921 Flower Bed Ct
- 2300 Dunlin Ln
- 2304 Dunlin Ln
- 4601 All Points View Way
- 4603 All Points View Way
- 2306 Dunlin Ln
- 4607 All Points View Way
- 10919 Flower Bed Ct
- 4609 All Points View Way
- 4611 All Points View Way
- 10917 Flower Bed Ct
- 4613 All Points View Way