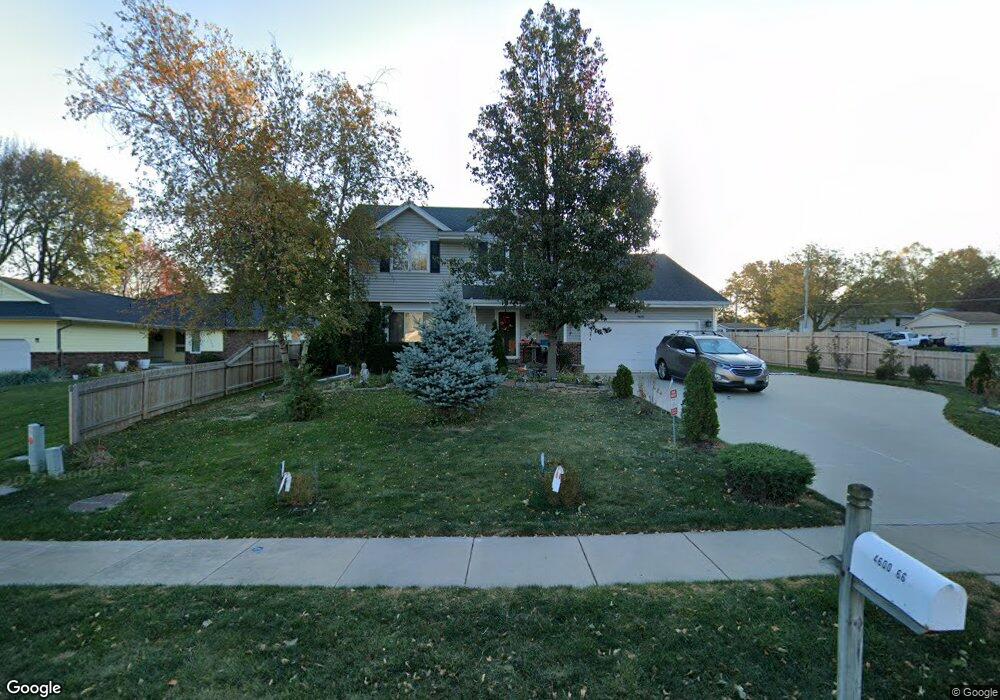
4601 66th St Urbandale, IA 50322
Estimated Value: $338,000 - $377,394
3
Beds
3
Baths
1,745
Sq Ft
$204/Sq Ft
Est. Value
About This Home
This home is located at 4601 66th St, Urbandale, IA 50322 and is currently estimated at $356,849, approximately $204 per square foot. 4601 66th St is a home located in Polk County with nearby schools including Timber Ridge Elementary School, Johnston Middle School, and Summit Middle School.
Ownership History
Date
Name
Owned For
Owner Type
Purchase Details
Closed on
Nov 28, 2011
Sold by
Kaiser John and Kaiser Catherine A
Bought by
Kaiser John J and Kaiser Catherine A
Current Estimated Value
Purchase Details
Closed on
Dec 18, 1998
Sold by
Snowden Michael L and Snowden Rita
Bought by
Kaiser John
Home Financials for this Owner
Home Financials are based on the most recent Mortgage that was taken out on this home.
Original Mortgage
$130,000
Outstanding Balance
$30,142
Interest Rate
7.02%
Estimated Equity
$326,707
Create a Home Valuation Report for This Property
The Home Valuation Report is an in-depth analysis detailing your home's value as well as a comparison with similar homes in the area
Home Values in the Area
Average Home Value in this Area
Purchase History
| Date | Buyer | Sale Price | Title Company |
|---|---|---|---|
| Kaiser John J | -- | None Available | |
| Kaiser John | $162,000 | -- |
Source: Public Records
Mortgage History
| Date | Status | Borrower | Loan Amount |
|---|---|---|---|
| Open | Kaiser John | $130,000 |
Source: Public Records
Tax History Compared to Growth
Tax History
| Year | Tax Paid | Tax Assessment Tax Assessment Total Assessment is a certain percentage of the fair market value that is determined by local assessors to be the total taxable value of land and additions on the property. | Land | Improvement |
|---|---|---|---|---|
| 2025 | $5,776 | $399,800 | $81,400 | $318,400 |
| 2024 | $5,776 | $373,200 | $75,000 | $298,200 |
| 2023 | $5,306 | $373,200 | $75,000 | $298,200 |
| 2022 | $5,970 | $292,200 | $60,700 | $231,500 |
| 2021 | $6,098 | $292,200 | $60,700 | $231,500 |
| 2020 | $5,996 | $283,100 | $58,700 | $224,400 |
| 2019 | $5,626 | $283,100 | $58,700 | $224,400 |
| 2018 | $5,416 | $251,000 | $51,000 | $200,000 |
| 2017 | $5,104 | $251,000 | $51,000 | $200,000 |
| 2016 | $4,978 | $231,700 | $46,800 | $184,900 |
| 2015 | $4,978 | $231,700 | $46,800 | $184,900 |
| 2014 | $5,056 | $233,200 | $47,000 | $186,200 |
Source: Public Records
Map
Nearby Homes