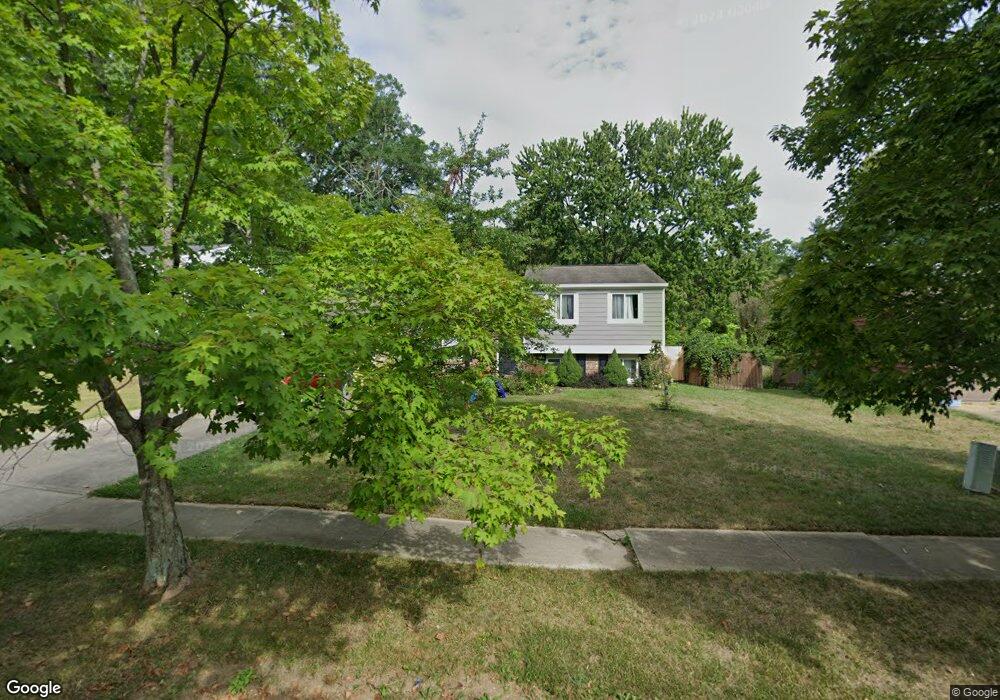
4601 Muirview Ct Batavia, OH 45103
Estimated Value: $244,000 - $299,000
3
Beds
2
Baths
936
Sq Ft
$283/Sq Ft
Est. Value
About This Home
This home is located at 4601 Muirview Ct, Batavia, OH 45103 and is currently estimated at $265,059, approximately $283 per square foot. 4601 Muirview Ct is a home located in Clermont County with nearby schools including Willowville Elementary School, West Clermont Middle School, and West Clermont High School.
Ownership History
Date
Name
Owned For
Owner Type
Purchase Details
Closed on
Oct 7, 2020
Sold by
Smallwood Kenneth R and Smallwood Kendra E
Bought by
Smallwood Kenneth R and Smallwood Kendra E
Current Estimated Value
Home Financials for this Owner
Home Financials are based on the most recent Mortgage that was taken out on this home.
Original Mortgage
$99,400
Outstanding Balance
$50,807
Interest Rate
2.9%
Mortgage Type
New Conventional
Estimated Equity
$214,252
Purchase Details
Closed on
Mar 24, 2005
Sold by
Smallwood Kenneth R and Smallwood Michelle L
Bought by
Smallwood Kenneth R
Purchase Details
Closed on
Jul 10, 2001
Sold by
Boggs Daniel P
Bought by
Smallwood Kenneth R and Smallwood Michelle L
Purchase Details
Closed on
Oct 14, 1993
Purchase Details
Closed on
Oct 2, 1984
Purchase Details
Closed on
Aug 2, 1984
Create a Home Valuation Report for This Property
The Home Valuation Report is an in-depth analysis detailing your home's value as well as a comparison with similar homes in the area
Home Values in the Area
Average Home Value in this Area
Purchase History
| Date | Buyer | Sale Price | Title Company |
|---|---|---|---|
| Smallwood Kenneth R | -- | None Available | |
| Smallwood Kenneth R | -- | None Available | |
| Smallwood Kenneth R | $126,250 | -- | |
| -- | $89,500 | -- | |
| -- | $63,000 | -- | |
| -- | $25,200 | -- |
Source: Public Records
Mortgage History
| Date | Status | Borrower | Loan Amount |
|---|---|---|---|
| Open | Smallwood Kenneth R | $99,400 | |
| Closed | Smallwood Kenneth R | -- |
Source: Public Records
Tax History
| Year | Tax Paid | Tax Assessment Tax Assessment Total Assessment is a certain percentage of the fair market value that is determined by local assessors to be the total taxable value of land and additions on the property. | Land | Improvement |
|---|---|---|---|---|
| 2024 | $4,051 | $80,330 | $13,830 | $66,500 |
| 2023 | $4,057 | $80,330 | $13,830 | $66,500 |
| 2022 | $3,198 | $54,880 | $9,450 | $45,430 |
| 2021 | $3,211 | $54,880 | $9,450 | $45,430 |
| 2020 | $3,214 | $54,880 | $9,450 | $45,430 |
| 2019 | $2,386 | $47,640 | $11,340 | $36,300 |
| 2018 | $2,411 | $47,640 | $11,340 | $36,300 |
| 2017 | $2,465 | $47,640 | $11,340 | $36,300 |
| 2016 | $2,465 | $44,100 | $10,500 | $33,600 |
| 2015 | $2,393 | $44,100 | $10,500 | $33,600 |
| 2014 | $2,392 | $44,100 | $10,500 | $33,600 |
| 2013 | $2,152 | $39,240 | $10,500 | $28,740 |
Source: Public Records
Map
Nearby Homes
- 4622 Muirridge Ct
- 4583 Creekwood Ct
- 4565 Shephard Rd
- 4573 Northcross Ct
- 4625 Locust Grove Ct
- 4575 Foxfire Ln
- 4686 Tealtown Rd
- 4322 Preston Place
- 1023 Glendale Dr
- 4746 Shephard Rd
- 1178 Mckinley Ct
- 4493 Schoolhouse Rd
- 4488 Glenwillow Dr
- 1234 Ben Avon
- 14 Tidewater Trace Unit 2207
- 2 Spotswood Common Unit 2006
- 4602 Ellsberry Ct
- 34 Banberry Trace Unit 1605
- 4469 Eva Ln
- 4442 Meese Dr
- 4603 Muirview Ct
- 4599 Muirview Ct
- 4597 Muirview Ct
- 4605 Muirview Ct
- 1187 Muirwood Ln
- 4602 Muirview Ct
- 4600 Muirview Ct
- 4598 Muirview Ct
- 1181 Muirwood Ln
- 1179 Muirwood Ln
- 1189 Muirwood Ln
- 1186 Muirwood Ln
- 1184 Muirwood Ln
- 1188 Muirwood Ln
- 1182 Muirwood Ln
- 4578 Muirvalley Ct
- 1180 Muirwood Ln
- 1190 Muirwood Ln
- 1175 Muirwood Ln
- 1178 Muirwood Ln
Your Personal Tour Guide
Ask me questions while you tour the home.