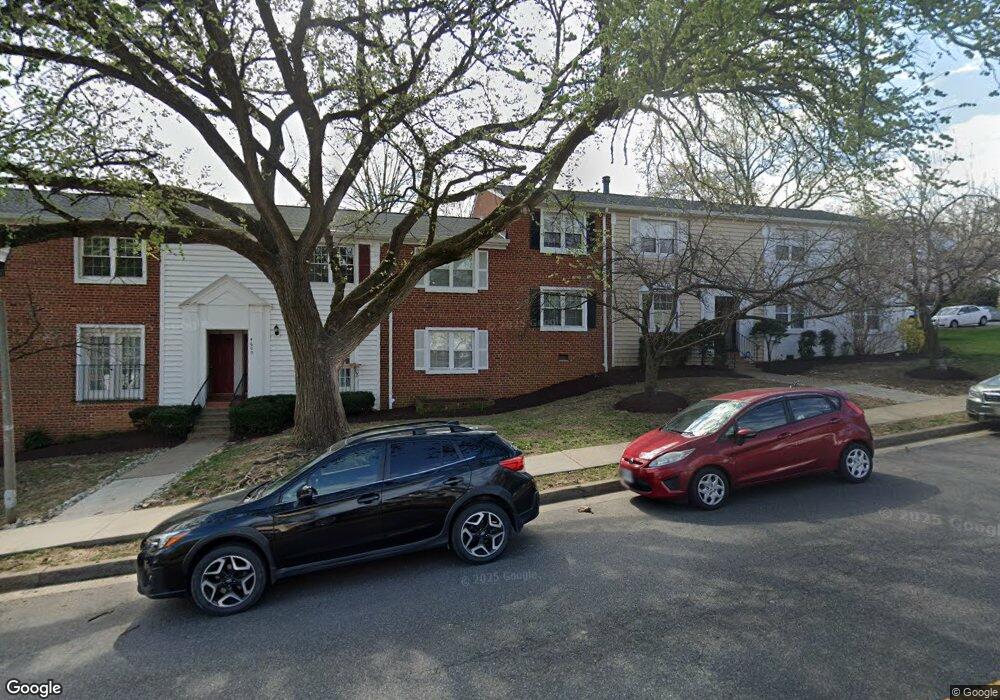
4602 28th Rd S Unit D Arlington, VA 22206
Fairlington NeighborhoodEstimated Value: $388,194 - $405,000
2
Beds
1
Bath
800
Sq Ft
$498/Sq Ft
Est. Value
About This Home
This home is located at 4602 28th Rd S Unit D, Arlington, VA 22206 and is currently estimated at $398,799, approximately $498 per square foot. 4602 28th Rd S Unit D is a home located in Arlington County with nearby schools including Abingdon Elementary School, Gunston Middle School, and Wakefield High School.
Ownership History
Date
Name
Owned For
Owner Type
Purchase Details
Closed on
May 1, 2020
Sold by
Huggins Amberlee
Bought by
Huggins Amberlee and Henle Joseph Peter
Current Estimated Value
Purchase Details
Closed on
Oct 3, 2008
Sold by
Widmayer Steven E
Bought by
Huggins Amberlee
Home Financials for this Owner
Home Financials are based on the most recent Mortgage that was taken out on this home.
Original Mortgage
$162,387
Outstanding Balance
$104,825
Interest Rate
5.83%
Mortgage Type
New Conventional
Estimated Equity
$293,974
Purchase Details
Closed on
Sep 25, 2002
Sold by
Massey Michele
Bought by
Huggins Amber Lee
Home Financials for this Owner
Home Financials are based on the most recent Mortgage that was taken out on this home.
Original Mortgage
$153,220
Interest Rate
6.25%
Purchase Details
Closed on
Jan 31, 2000
Sold by
Kusek Laurie J
Bought by
Massey Michele M
Home Financials for this Owner
Home Financials are based on the most recent Mortgage that was taken out on this home.
Original Mortgage
$96,500
Interest Rate
7.83%
Create a Home Valuation Report for This Property
The Home Valuation Report is an in-depth analysis detailing your home's value as well as a comparison with similar homes in the area
Home Values in the Area
Average Home Value in this Area
Purchase History
| Date | Buyer | Sale Price | Title Company |
|---|---|---|---|
| Huggins Amberlee | -- | None Available | |
| Huggins Amberlee | -- | -- | |
| Huggins Amber Lee | $191,525 | -- | |
| Massey Michele M | $99,500 | -- |
Source: Public Records
Mortgage History
| Date | Status | Borrower | Loan Amount |
|---|---|---|---|
| Open | Huggins Amberlee | $162,387 | |
| Previous Owner | Huggins Amber Lee | $153,220 | |
| Previous Owner | Massey Michele M | $96,500 |
Source: Public Records
Tax History
| Year | Tax Paid | Tax Assessment Tax Assessment Total Assessment is a certain percentage of the fair market value that is determined by local assessors to be the total taxable value of land and additions on the property. | Land | Improvement |
|---|---|---|---|---|
| 2025 | $3,953 | $382,700 | $61,600 | $321,100 |
| 2024 | $3,888 | $376,400 | $61,600 | $314,800 |
| 2023 | $3,694 | $358,600 | $61,600 | $297,000 |
| 2022 | $3,694 | $358,600 | $61,600 | $297,000 |
| 2021 | $3,634 | $352,800 | $61,600 | $291,200 |
| 2020 | $3,398 | $331,200 | $41,600 | $289,600 |
| 2019 | $3,128 | $304,900 | $41,600 | $263,300 |
| 2018 | $2,942 | $292,400 | $41,600 | $250,800 |
| 2017 | $2,799 | $278,200 | $41,600 | $236,600 |
| 2016 | $2,781 | $280,600 | $41,600 | $239,000 |
| 2015 | $2,844 | $285,500 | $41,600 | $243,900 |
| 2014 | $2,796 | $280,700 | $41,600 | $239,100 |
Source: Public Records
Map
Nearby Homes
- 4614 28th Rd S Unit B
- 4617 28th Rd S Unit B
- 2903 S Woodley St Unit A
- 2505 S Walter Reed Dr Unit A
- 2805 C S Woodrow St Unit 1
- 2905 S Woodley St Unit A
- 2907 S Woodley St Unit C
- 4531 28th Rd S Unit 97
- 2800 A S Wakefield St Unit A
- 4519 28th Rd S Unit A
- 2568 B S Arlington Mill Dr Unit B
- 2544 S Walter Reed Dr Unit B
- 2594 H S H S Arlington Mill Dr 8 Unit 8
- 2856 S Buchanan St Unit B1
- 4829 28th St S Unit A
- 4862 28th St S Unit A1
- 2906 S Buchanan St
- 4849 28th St S Unit B
- 2813 S Columbus St
- 2825 S Columbus St
- 4602 28th Rd S Unit A
- 4602 28th Rd S Unit C
- 4602 28th Rd S Unit A
- 4602 28th Rd S Unit B
- 4602 28th Rd S Unit A
- 4606 28th Road B S Unit B
- 4606 28th Road C S Unit C
- 4602 28th Road A S Unit A
- 4604 28th Road B S Unit B
- 4600 28th Rd S Unit C
- 4600 28th Rd S Unit D
- 4600 28th Rd S Unit C
- 4600 28th Rd S Unit B
- 4600 28th Rd S Unit A
- 4600 28th Rd S Unit C
- 4600 28th Rd S Unit D
- 4600 28th Rd S Unit B
- 4600 28th Rd S Unit A
- 4604 28th Rd S Unit D
- 4604 28th Rd S Unit C
Your Personal Tour Guide
Ask me questions while you tour the home.