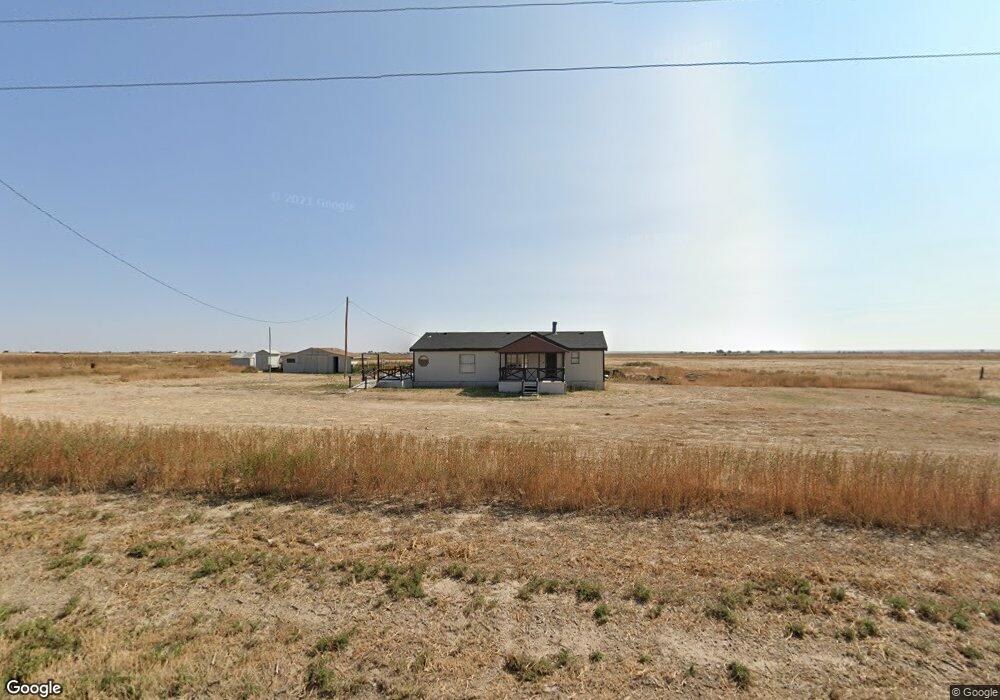
4602 36th Ln Avondale, CO 81022
Estimated Value: $176,005 - $412,000
3
Beds
2
Baths
1,664
Sq Ft
$177/Sq Ft
Est. Value
About This Home
This home is located at 4602 36th Ln, Avondale, CO 81022 and is currently estimated at $294,501, approximately $176 per square foot. 4602 36th Ln is a home located in Pueblo County with nearby schools including Vineland Elementary School, Vineland Middle School, and Pueblo County High School.
Ownership History
Date
Name
Owned For
Owner Type
Purchase Details
Closed on
Nov 8, 2021
Sold by
Realty Colorado Llc
Bought by
Crudale Austin T
Current Estimated Value
Home Financials for this Owner
Home Financials are based on the most recent Mortgage that was taken out on this home.
Original Mortgage
$265,980
Outstanding Balance
$243,792
Interest Rate
3.01%
Mortgage Type
VA
Estimated Equity
$50,709
Purchase Details
Closed on
Jul 30, 2021
Sold by
Josue Nunez
Bought by
Realty Colorado Llc
Home Financials for this Owner
Home Financials are based on the most recent Mortgage that was taken out on this home.
Original Mortgage
$165,000
Interest Rate
2.93%
Mortgage Type
New Conventional
Purchase Details
Closed on
Oct 15, 2020
Sold by
Salazar Diego
Bought by
Nunez Josue
Purchase Details
Closed on
Sep 18, 2009
Sold by
Nunez Maria P
Bought by
Salazar Diego
Create a Home Valuation Report for This Property
The Home Valuation Report is an in-depth analysis detailing your home's value as well as a comparison with similar homes in the area
Home Values in the Area
Average Home Value in this Area
Purchase History
| Date | Buyer | Sale Price | Title Company |
|---|---|---|---|
| Crudale Austin T | $260,000 | None Listed On Document | |
| Realty Colorado Llc | $165,000 | Land Title | |
| Nunez Josue | -- | Nunez Josue | |
| Salazar Diego | -- | None Available |
Source: Public Records
Mortgage History
| Date | Status | Borrower | Loan Amount |
|---|---|---|---|
| Open | Crudale Austin T | $265,980 | |
| Previous Owner | Realty Colorado Llc | $165,000 |
Source: Public Records
Tax History Compared to Growth
Tax History
| Year | Tax Paid | Tax Assessment Tax Assessment Total Assessment is a certain percentage of the fair market value that is determined by local assessors to be the total taxable value of land and additions on the property. | Land | Improvement |
|---|---|---|---|---|
| 2024 | $1,132 | $14,240 | -- | -- |
| 2023 | $1,147 | $17,930 | $4,020 | $13,910 |
| 2022 | $886 | $11,180 | $1,990 | $9,190 |
| 2021 | $908 | $11,508 | $2,050 | $9,458 |
| 2020 | $666 | $8,430 | $1,430 | $7,000 |
| 2019 | $664 | $8,432 | $1,430 | $7,002 |
| 2018 | $491 | $6,236 | $1,440 | $4,796 |
| 2017 | $492 | $6,236 | $1,440 | $4,796 |
| 2016 | $519 | $6,586 | $1,592 | $4,994 |
| 2015 | $516 | $6,586 | $1,592 | $4,994 |
| 2014 | $558 | $7,153 | $1,592 | $5,561 |
Source: Public Records
Map
Nearby Homes
- 4726 36th Ln
- 4500 36th Ln
- 4676 36th Ln
- N/A N A
- 4850 Doyle Rd
- 36418 Harbour Rd
- 4425 Broadacre Rd
- 4334 36th Ln
- 4420 Broadacre Rd
- 4385 Broadacre Rd
- 37037 Harbour Rd
- 4284 36th Ln
- 37425 Harbour Rd
- 35095 Harbour Rd
- 35095 Harbour Rd
- 35095 Harbour Rd Unit n/a
- 0 Harbour Rd Unit 3 91699
- 0 Harbour Rd Unit Lot 96555
- 0 Harbour Rd Unit 5 99781
- 0 Harbour Rd Unit 6 99768