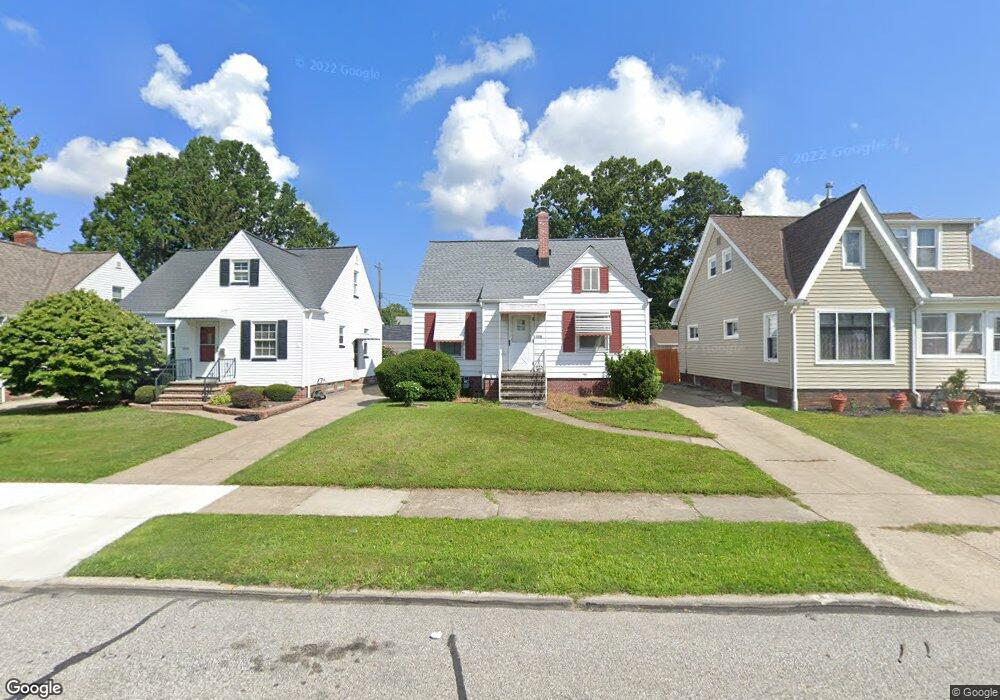
4602 Pershing Ave Cleveland, OH 44134
Estimated Value: $161,000 - $196,000
3
Beds
1
Bath
1,093
Sq Ft
$160/Sq Ft
Est. Value
About This Home
This home is located at 4602 Pershing Ave, Cleveland, OH 44134 and is currently estimated at $174,776, approximately $159 per square foot. 4602 Pershing Ave is a home located in Cuyahoga County with nearby schools including Thoreau Park Elementary School, Shiloh Middle School, and Normandy High School.
Ownership History
Date
Name
Owned For
Owner Type
Purchase Details
Closed on
Jan 12, 2009
Sold by
Sunderavel Velayuthan and Velayuthan Ariyamalar
Bought by
Sunderavel Velayuthan and Velayuthan Ariyamalar
Current Estimated Value
Home Financials for this Owner
Home Financials are based on the most recent Mortgage that was taken out on this home.
Original Mortgage
$62,050
Outstanding Balance
$15,598
Interest Rate
5.53%
Mortgage Type
Purchase Money Mortgage
Estimated Equity
$159,178
Purchase Details
Closed on
Jan 9, 2009
Sold by
Zinsky Marion
Bought by
Sunderavel Velayuthan and Velayuthan Ariyamalar
Home Financials for this Owner
Home Financials are based on the most recent Mortgage that was taken out on this home.
Original Mortgage
$62,050
Outstanding Balance
$15,598
Interest Rate
5.53%
Mortgage Type
Purchase Money Mortgage
Estimated Equity
$159,178
Purchase Details
Closed on
Mar 22, 1983
Sold by
Zinsky Stanley J and Zinsky Marion
Bought by
Marion Stanley J and Marion Zinsky
Purchase Details
Closed on
Jan 1, 1975
Bought by
Zinsky Stanley J and Zinsky Marion
Create a Home Valuation Report for This Property
The Home Valuation Report is an in-depth analysis detailing your home's value as well as a comparison with similar homes in the area
Home Values in the Area
Average Home Value in this Area
Purchase History
| Date | Buyer | Sale Price | Title Company |
|---|---|---|---|
| Sunderavel Velayuthan | -- | Freedom Title | |
| Sunderavel Velayuthan | $73,000 | Freedom Title | |
| Marion Stanley J | -- | -- | |
| Zinsky Stanley J | -- | -- |
Source: Public Records
Mortgage History
| Date | Status | Borrower | Loan Amount |
|---|---|---|---|
| Open | Sunderavel Velayuthan | $62,050 |
Source: Public Records
Tax History
| Year | Tax Paid | Tax Assessment Tax Assessment Total Assessment is a certain percentage of the fair market value that is determined by local assessors to be the total taxable value of land and additions on the property. | Land | Improvement |
|---|---|---|---|---|
| 2024 | $2,564 | $50,330 | $10,990 | $39,340 |
| 2023 | $1,803 | $32,630 | $9,070 | $23,560 |
| 2022 | $1,810 | $32,620 | $9,070 | $23,560 |
| 2021 | $1,856 | $32,620 | $9,070 | $23,560 |
| 2020 | $1,490 | $25,100 | $6,970 | $18,130 |
| 2019 | $1,399 | $71,700 | $19,900 | $51,800 |
| 2018 | $1,483 | $25,100 | $6,970 | $18,130 |
| 2017 | $1,086 | $19,740 | $5,250 | $14,490 |
| 2016 | $1,747 | $19,740 | $5,250 | $14,490 |
| 2015 | $1,628 | $19,740 | $5,250 | $14,490 |
| 2014 | $1,628 | $20,170 | $5,360 | $14,810 |
Source: Public Records
Map
Nearby Homes
- 4410 Wood Ave
- 4312 Kenmore Ave
- 4101 Pershing Ave
- 4000 Pershing Ave
- 4607 Lincoln Ave
- 5212 Wood Ave
- 4419 Lincoln Ave
- 5107 Krueger Ave
- 4323 Russell Ave
- 4011 Liggett Dr
- 4717 Snow Rd
- 3810 Lincoln Ave
- 5432 State Rd
- 4514 Tuxedo Ave
- 4007 Tuxedo Ave
- 3802 Russell Ave
- 3407 Grovewood Ave
- 5268 W 46th St
- 5279 W 50th St
- 4115 Sheraton Dr
- 4606 Pershing Ave
- 4530 Pershing Ave
- 4610 Pershing Ave
- 4526 Pershing Ave
- 4614 Pershing Ave
- 4522 Pershing Ave
- 4601 Torrington Ave
- 4605 Torrington Ave
- 4702 Pershing Ave
- 4518 Pershing Ave
- 4529 Torrington Ave
- 4609 Torrington Ave
- 4525 Torrington Ave
- 4613 Torrington Ave
- 4603 Pershing Ave
- 4607 Pershing Ave
- 4531 Pershing Ave
- 4514 Pershing Ave
- 4706 Pershing Ave
- 4521 Torrington Ave
Your Personal Tour Guide
Ask me questions while you tour the home.